An envelope arrives this fall for the high school senior in your house. It is from a college she never applied to, and it says she is in. A week later a second one arrives from a different college. It looks the same and it says the same thing. Is one of them a better offer than the other? How would you tell?
Hundreds of colleges are now sending acceptance letters to students who never applied. The Wall Street Journal reported it on September 3. A student fills out a short form, a transcript goes in, and the offers arrive on their own. No essay, no fee, no full application. Common App is sending offers from 234 colleges this fall. Niche has more than 150 on its platform. More than a dozen states run programs of their own.[1][2][3]
Nearly everyone the Journal quoted spoke well of it. The head of the college counseling association said the institution now applies to the student. The president of one college said it could no longer wait for students to come to it. A high school senior who got an offer from a Georgia college said getting in was less scary than she expected. “It just felt good to be wanted somewhere.”[1]
When the article landed in a thread with my coauthors, the question was how to think about it. I said the honest answer was that we did not know yet. If these letters came from good schools with real money attached, that was one thing. If they came from schools that leave their students behind, that was a different story. We should get the list and look.
So I got the list. Here is what it says.
Two kinds of program send these letters, and they are not sending the same thing
The Journal treats direct admissions as one trend. Run the institutions in the state programs and on Niche through the data and it splits in two.
The first group is colleges on platforms like Niche. Their letters come with money. Niche says its average user receives more than $17,000 a year in scholarship offers.[1] These are mostly private schools with high sticker prices, and the platform is where they discount. The letter is an acceptance and a coupon in the same envelope.
The second group is institutions in state programs. Alabama, Georgia, Idaho, Wisconsin, Hawaii and others send offers to eligible students, and Connecticut admits any Connecticut senior over its GPA bar who applies.[4] Most are public universities whose sticker prices are already low, with less room to discount. Some are private colleges that joined the state’s list. Either way, most of these letters carry no money at all. Michigan’s and Alabama’s, which run on the same platform,[4] are the clearest exceptions, and the head of the network that launched Michigan’s program said so plainly: “Our best pitch is to put the money on the table.”[1]
Those two envelopes look the same on a kitchen table. They are not the same.
What the data says about each
I ran seventy-one four-year institutions in the seven state programs through the model behind this site, fifty-one of them public and twenty private, and twenty-eight colleges from Niche’s directory. Three four-year schools on the state lists are not in the run, because federal data lacks the earnings or cost figures the model needs. Several of the programs also list two-year and technical colleges, which this run does not cover.[4]
The model compares the lifetime value of a degree from each school, after taxes and after the four years of earnings a student gives up, against the path of a high school graduate who went straight to work.[5]
Start with the Niche colleges, because they surprised me.
If you count only the students who finish, the twenty-eight Niche colleges look better than the national average. Forty-three percent of them leave the median graduate behind the high school path at net price, against fifty-seven percent of all four-year institutions with an eight-year completion record.[5] Net price is what students pay on average after grant aid.
At full sticker, eighty-nine percent of them are behind, which tells you the discount is not a courtesy. It is the whole business.
Now the state programs. Sixty-nine percent of the four-year institutions in those seven programs leave the median graduate behind at net price. That is worse than the national average, not better.
That is the graduating basis. It answers one question: what does the degree return to someone who finishes it? A student holding an acceptance letter has not finished anything. The question that matters to her is different. What does the degree return to someone who starts?
To answer that you have to count the students who never finish there, and price the path the model gives them: two years of cost, two years of forgone earnings, and then a working life at the wage of someone with some college and no degree. The model does that.[5] It counts students who transfer out as not finishing, even though some of them finish somewhere else. Call that the enrolling basis. Here is what changes.
The Niche colleges fall from forty-three percent behind to sixty-one. Their median advantage over the high school path at net price, about ten thousand dollars if you finish, becomes a nine thousand dollar deficit averaged over everyone who starts.
The state programs go from sixty-nine percent behind to eighty-six percent.
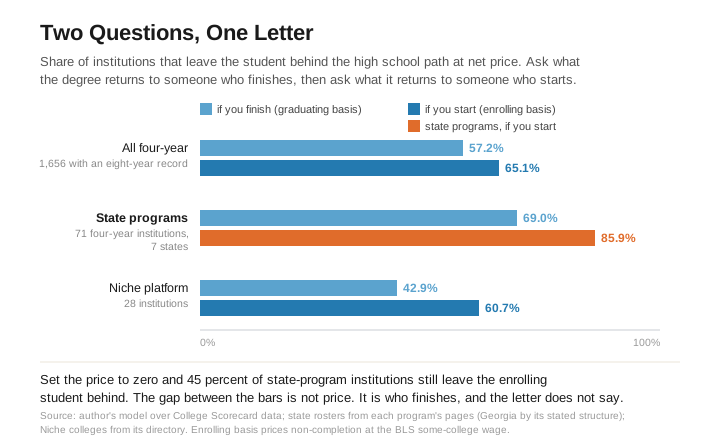
More than eight in ten of the four-year institutions. Weight them by enrollment, since a few large universities do clear the bar, and it is still nearly eight in ten of the seats. A student who opens a four-year offer from one of these state programs is being pointed, far more often than not, at a school that leaves the typical enrolling student behind a high school graduate who went straight to work.
The basis is the story
I want to sit on that gap, because it is the point.
Georgia is the clearest case. Georgia MATCH sends seniors across the state a letter listing the public colleges and universities they qualify for, though they still have to apply.[4] Count only the graduates, and two-thirds of the eighteen four-year schools in the run leave the median graduate behind at net price. Count everyone who enrolls, and it is seventeen of eighteen. Sixty-seven percent becomes ninety-four. The schools did not change. The question did.
Seventeen of the ninety-nine institutions in the run flip from ahead to behind when you change the question, among them the University of Hartford, the University of South Alabama, Boise State, Georgia Southern, Northern Kentucky, the University of Wisconsin at Milwaukee and at Stout. Every one of them clears the bar for its graduates. Every one of them falls behind once you count the students who start and do not finish there, and the letter goes to the student who is about to start.
That is what the letter does not say. Not that the school is bad. These seventeen are not bad schools. It does not say that the school is two very different bets, one if she finishes and one if she does not, or how many of its students finish.
Three more things, so nobody reads this as something it is not.
It is not a price problem. Set the cost of every state-program institution to zero and forty-five percent of them still leave the typical enrolling student behind. In Georgia it is half. Free does not fix a school where nearly a third never finish there, or where the ones who do earn too little more to pay back the years they gave up.
Idaho is the clearest place where it is a price problem. The four Idaho four-year schools in the run are all behind at net price on the enrolling basis. Boise State returns about eleven and a half thousand dollars over high school if you finish and loses about six thousand averaged over everyone who starts. But all four clear if the seat is free, on both bases. Idaho is the only state in this set where every school in the run clears once the seat is free.
And it is not a story about the South. Take Alabama and Georgia out entirely and the remaining thirty-nine institutions, in Idaho, Wisconsin, Connecticut, Michigan and Hawaii, are seventy-nine percent behind at net price for the student who starts.
And it is not a claim about what a student would have done instead. The model compares each school to a high school graduate who went straight to work. Most of the students who enroll after getting one of these letters were probably going to college somewhere. A study of Idaho’s program by the education researchers Taylor Odle and Jennifer Delaney found it lifted first-time enrollment by four to eight percent, mostly at two-year open-access colleges.[6]
So for most students who act on one, the real question is not this school or no school. It is this school or the one a student would have found on her own, and the letter cannot answer that either.
What the eight in ten measures is what the letter offers, not what it changes.
One thing the model cannot see cuts the other way. Every completion rate here is the school’s rate for the students it already enrolls. A student who arrives by direct admission skipped the usual application, and may finish at a lower rate than the ones who went through it. If so, on that count the numbers above are the kind version.
The obvious defense, and where it stops
The defense of direct admissions is that more options are better than fewer, and it is right.
A student with no counselor, no parent who went to college, and no idea whether she is good enough, gets a letter that says she is in. That is not nothing.
The application process is a filter, and in my experience it filters out many of the students who need the most help getting through it. Removing it should help them, though Odle and Delaney found that Idaho’s program did little to change how many low-income students enrolled, counted by who was eligible for a federal Pell grant.[6]
Niche says its program reaches a larger share of first-generation students and students of color than ordinary admissions, and I have no reason to doubt it.[1] The Niche colleges, counted by their graduates, make the point. More options, and by that count not bad ones.
But an option you cannot evaluate is not an option. It is a draw.
Niche says its students receive an average of eight direct-admission offers.[1] Eight envelopes. Same font, same size, same word at the top.
One of them could be a school like Boise State, which is one bet if you finish and a different one if you do not. One of them is a coupon on a private college that clears at the discounted price. One of them is a state university where a third of the students who start have not finished there eight years on and the ones who finish earn too little more to cover what it cost. Nothing on any of the eight tells her which is which.
I have written elsewhere about markets where the buyer cannot tell the good car from the bad one and offers the average price for both.[7] This is that market, and the buyer is seventeen.
Alabama shows what is at stake. Nearly half the students at its participating four-year schools receive Pell grants.[5] They have the least room to find out four years in that the letter was the wrong kind. So send the letters, and put something on them.
Alabama already tried, and fixed the wrong line
Alabama saw the problem. A consultant told the Journal, “There’s a big difference between getting in and being able to afford to go,” and Alabama’s answer was to make sure every participating institution put price information in its first offer letter.[1]
Read that against the numbers above. Half of the Alabama institutions in the run leave even the median graduate behind if the price is zero. The state put the price on the letter and left off the two numbers that decide whether the price is worth paying: how many students finish, and what they earn when they do.
Both numbers exist. The federal government publishes both through the College Scorecard,[5] along with earnings for many individual programs. They fit on one line. Connecticut already shows a version of both. Its automatic-admission page lists each participating school’s net cost, graduation rate and average earnings, taken from the College Scorecard.[4]
So here is the ask, and it is small. Put the outcome in the envelope. Next to the acceptance, in the same font: the share of students at this school who finish, and what its graduates earn four years out, by program where the data exist. Michigan’s program already lets colleges put a scholarship in the letter so applicants can compare what each one costs.[1][4] Attach the return the same way.
That does not make the letter smaller. It makes eight letters different from each other, which is what turns a draw back into a choice.
I told my coauthors we should get the list and look. The list says the good version of this idea and the bad version arrive in the same envelope. The students these letters are meant to reach, the ones with no counselor and no parent who went to college, are the ones least able to tell them apart. Nobody built the letter to tell them.
So go back to the two envelopes on your kitchen table. How would you tell? You don’t have to wait for the letter to change. Put both schools into the Guided ROI Interview on this site, at what each would cost you. It shows, side by side, how many of each school’s students finish, what its graduates earn, and what its students earn ten years after they start, whether they finished or not.
Reference Sources
- Fernandez, Roshan. “Hundreds of Colleges Are Sending Acceptance Letters to Kids Who Didn’t Even Apply.” The Wall Street Journal, September 3, 2026, print edition September 4. Source for the program mechanics, the Angel Perez, Karlyn Crowley, Eden Johnson, Beth Kraemer and Ryan Fewins-Bliss quotations, the Niche figures ($17,000 average in scholarship offers, eight offers per student, first-generation and students-of-color share), the Alabama price-disclosure requirement, and Michigan’s scholarship attachment.
- Common App. “Common App expands direct admissions program in 2026-27 with 234 participating institutions.” Common App blog, accessed September 4, 2026. Public and private institutions in 42 states and Washington, D.C. The post lists the participating members by state.
- Niche. “More Than 155 Colleges Nationwide Providing Real-Time Acceptance and Scholarship Offers Through Niche Direct Admissions.” Press release, August 4, 2026. Accessed September 4, 2026. More than 155 partner institutions across more than thirty states.
- State program rosters, each from the program’s own page, retrieved September 4, 2026 unless noted. Direct Admit Wisconsin, ten UW campuses, with Madison, La Crosse and Eau Claire not participating. Direct2UH, Hawaii, ten campuses including Mānoa (as of September 24, 2026). Connecticut Automatic Admission Program, ten institutions. Alabama Direct Admission, Participating Alabama Colleges & Universities, four-year roster via Alabama Possible, seventeen institutions (as of September 24, 2026). MI College Match, Michigan College Access Network launch release of August 12, 2026, eighteen institutions at launch. Idaho Campus Choice, eight public institutions. Georgia MATCH, participating institutions as listed, matching the program’s stated structure: the University System’s twenty-six schools less Georgia College, Georgia Tech and the University of Georgia, which review applications holistically, and the Technical College System’s twenty-two colleges. The individual roster sits behind a student login.
- Author’s model over U.S. Department of Education College Scorecard data, 1,656 four-year institutions with an eight-year outcome cohort. The graduating basis prices four years of cost against completers’ median earnings four years after graduation, after federal taxes, discounted at 7.8 percent, against a high school baseline over the same working life. The enrolling basis weights that result by each institution’s completion rate and prices the non-completer at two years of cost and forgone earnings followed by the some-college wage, set at 9.7 percent above the high school wage from the Bureau of Labor Statistics’ 2024 figures. Its 2025 table, updated September 1, 2026, puts the gap at 9.9 percent, enough to move one school and take the state programs’ enrolling-basis share behind at zero cost from 45.1 percent to 43.7. Completion on the enrolling basis is the federal eight-year Outcome Measures award rate plus the students the data records as status unknown, who are counted as finishing. Students still enrolled at the same institution eight years on, and students who left without its degree and enrolled at another institution, whether or not they finished there, are counted as not finishing. National shares on the enrolling basis are 65.1 percent behind at net price and 33.9 percent at zero cost. On the graduating basis, 57.2 and 29.1. Cohort: seventy-one institutions in the seven state programs in note 4, fifty-one public and twenty private, and twenty-eight institutions from Niche’s directory. These are four-year Niche partners I could confirm and match to federal data, not all of the platform’s more than 155 partners and not a random sample of them. Not in the state cohort: Miles College, Selma University and Spring Hill College, all on Alabama’s list. Federal data has no earnings four years after graduation for Miles and Spring Hill and no cost of attendance or net price for Selma. Schools the federal data classes as mainly two-year, such as Goodwin University on Connecticut’s list, are outside the four-year set. Alabama Pell share is enrollment-weighted across the fourteen participating four-year institutions in the run, 49 percent. The share of seats weights each state-program institution by its enrollment in the federal data.
- Odle, Taylor K., and Jennifer A. Delaney. “You Are Admitted! Early Evidence on Enrollment from Idaho’s Direct Admissions System.” Research in Higher Education 63 (September 2022): 899–932. Abstract at Springer Nature Link, accessed September 24, 2026. Idaho’s program raised first-time undergraduate enrollment by four to eight percent, about fifty to one hundred students per campus, with the gains concentrated at two-year open-access institutions and minimal-to-no effect on Pell-eligible enrollment.
- Shivamber, Leon. “Nobody Can Tell If You Are Right.” shivamber.com, August 2026. Companion essay.