You have probably seen the chart. The median first-time homebuyer, it says, was 29 years old in 1981 and is 40 today. The repeat buyer, the family trading up to a bigger house, is now 62.[1] First-time buyers, it says, have fallen to 21 percent of the market, the lowest share the National Association of Realtors (NAR) has ever recorded.[1] The chart has circulated for months, shared by economists as prominent as Mohamed El-Erian.
Smart people share it because it confirms something they correctly sense. Something has gone wrong for the young American family. The sensing is right. The chart is not.
I know because I built an early draft of this essay on top of it. Then I ran the chart through the same tests I apply to every famous college statistic, and it failed them. The honest story turned out to be worse than the viral one, and you need the honest story to find the fix.
Test the famous number first
Three tests, the same ones every famous number should face. What is it compared to? How was it measured? Do other sources see the same thing?
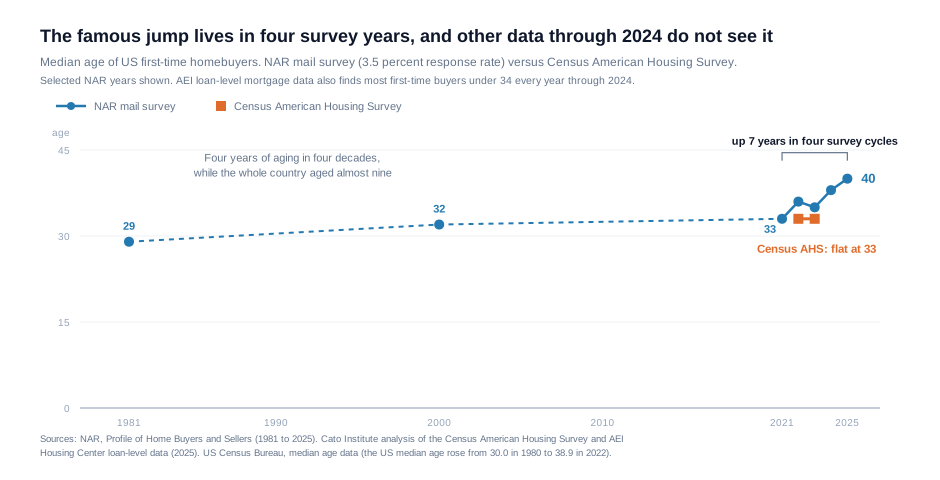
Start with the benchmark. The United States itself got older. The Census Bureau puts the median American at 30 years old in 1980 and 38.9 in 2022, almost nine years of aging for the whole country.[2][3] Buyer ages do not have to climb in lockstep with that. Some drift still comes free with an older country, no crisis required. A chart with no benchmark invites you to read ordinary aging as catastrophe.
Now hold NAR’s own numbers against that baseline. In NAR’s survey, the median first-time buyer was 29 in 1981, 32 in 2000, and 33 in 2021.[4] Four years of aging across four decades, in a country that aged nine. Then the series jumps seven years in four survey cycles, from 33 in 2021 to 40 in 2025. Seven of the chart’s eleven years live in the last four years of one survey.
So check the measurement. NAR’s number comes from a 120-question survey sent by mail. For the latest report, NAR mailed 173,250 of them and got 6,103 back, a 3.5 percent response rate.[1] Think about who completes a long mailed survey about their home purchase, and who throws it away. A 3.5 percent self-selected sample cannot be trusted to measure the market. It measures who answers mail.
Then check the other sources. In a comparison run by the Cato Institute, the Census Bureau’s American Housing Survey, a far larger government survey, tracked NAR closely for most of the previous 25 years. When NAR jumped in 2022, the AHS did not move. Through 2023, its latest year, it shows the median first-time buyer holding at 33. The AEI Housing Center, working from actual mortgage records rather than surveys, finds the age distribution of first-time buyers nearly unchanged from 2018 through 2024, with most of them under 34 every year.[4] And the economist Connor O’Brien, working from the Census Bureau’s own large surveys, puts the median age of all recent buyers at 41 to 42, a long way from NAR’s latest all-buyer median of 59. He estimates the survey now overstates the typical buyer’s age by 15 to 20 years, and the typical first-time buyer’s by 5 to 10.[5]
The repeat-buyer age of 62 is the least reliable of all. O’Brien’s two gaps point the same way. An overstatement of 15 to 20 years for all buyers, against 5 to 10 for first-time buyers, leaves the repeat buyers, 79 percent of NAR’s sample, carrying most of it. And as younger buyers fall out of the survey, the sample’s mix shifts older even if no individual family changed its behavior at all. A change in who is in the sample, presented as a change in how people live. Famous numbers often fail this way, and the failure tends to flatter the story the sharer already believed.
The worry survives the chart
Here is the uncomfortable part. The chart is wrong, and the worry behind it is still right.
You do not learn what happened to young buyers by surveying the people who bought. You learn it by reading the balance sheets of the people who did not. The question worth asking is what happened to the savings and the spare money of the young American household. That answer does not come from a mail survey. It sits in the Federal Reserve’s data, and it is worse than the chart.
Follow the capital
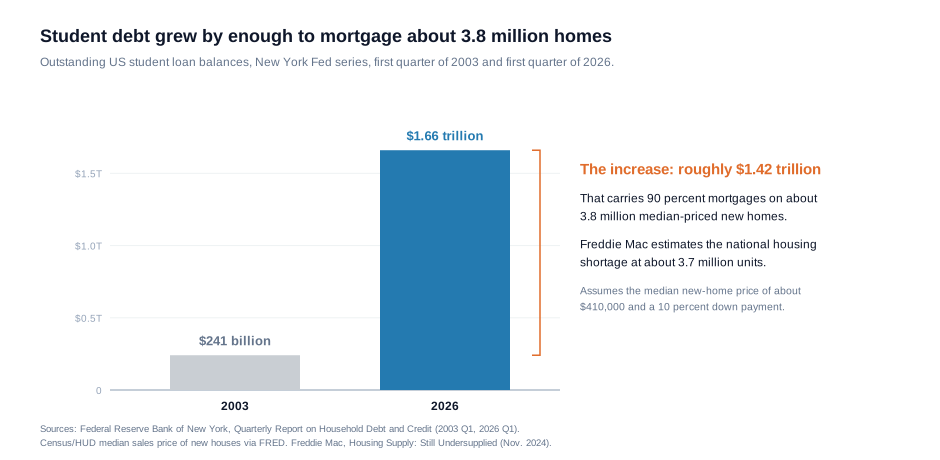
In 2003, when the Federal Reserve Bank of New York began tracking it, Americans owed $241 billion in student loans. By the first quarter of 2026, the New York Fed counted $1.66 trillion. The increase alone is roughly $1.42 trillion.[6]
Now ask what would have happened instead. Suppose families had borrowed that same money for homes instead. Assume a first-time buyer putting 10 percent down on the median new home, which sold for about $410,000 in mid-2026.[7] Each home carries a mortgage of roughly $370,000, so $1.42 trillion of mortgage debt carries about 3.8 million homes, and more at the lower prices that prevailed while the debt was building. The national housing shortage sits at the center of the housing debate. Estimates of it vary by method, and Freddie Mac put it at about 3.7 million units in late 2024.[8]
Stop and absorb that. The growth in student debt since 2003 would carry mortgages on roughly as many homes as the country is short.
The per-household version is plainer still. About 42 million Americans carry $1.72 trillion in federal student loans, by the Education Department’s own count, which runs above the New York Fed’s.[9] Spread that across them and it comes to nearly $41,000 per borrower, while a 10 percent down payment on that median home is $41,000. Per borrower, America is carrying nearly a full down payment in student debt. Graduate degrees pull that average up, so the typical borrower owes less. The total is what matters here, and the total does not care which borrower holds it.
And the two compete directly. A mortgage lender counts the student loan payment against the income available to carry a mortgage.[10] Every month of paying that student loan subtracts twice, once from the savings account where the down payment would grow, and once from the loan size a lender will approve.
This is where cause and effect, and not only arithmetic, enters. Four Federal Reserve economists, Alvaro Mezza, Daniel Ringo, Shane Sherlund and Kamila Sommer, studied the link directly. Among the public four-year college students they examined, every $1,000 in student debt lowers the homeownership rate in the mid-twenties by about 1.5 percentage points, equal, they write, to an average delay of 2.5 months in becoming a homeowner. In a later Fed summary, three of the same economists traced a little over 20 percent of the drop in homeownership among 24- to 32-year-olds from 2005 to 2014 to rising student debt. They called it “an important factor” but “not the central cause of the decline.”[10] Meanwhile the median net worth of a household under 35 was about $39,000 in the Fed’s 2022 survey, less than that one down payment.[11]
Each number does a different job. The $1.42 trillion measures how much money was pulled away. It is not a claim that every one of those dollars would have bought a house, since some of that borrowing financed degrees that paid for themselves and some financed graduate training with strong returns. The evidence for cause sits with the Fed study. Together they say the same thing from two directions. Enormous debts now compete with the accounts where down payments grow, and the borrowers the Fed studied bought their first homes later.
There is one more layer, and it is how wealth compounds. A house is no magic asset. It carries taxes, upkeep, and interest, and borrowing against it can hurt, as 2008 showed. But check where the 2008 damage landed. The economists Stefania Albanesi, Giacomo De Giorgi and Jaromir Nosal traced the rise in defaults mostly to real estate investors,[12] and Atif Mian and Amir Sufi traced at least 39 percent of new defaults to owners borrowing against houses they already had.[13] The family that bought one home to live in it, through a loan a lender actually checked, and did not borrow against it later, is not where either study found the damage. That is the point. A mortgage on a homestead is structure, not magic. On a fixed-rate loan, the payment stays the same while inflation shrinks it. Part of every payment is forced saving. The gain is the rent the family never pays again. And the law now requires the lender to confirm the borrower can carry it.[14] Student lending lacks most of those features, and that difference is the subject of the next essay in this series.
Now run the median four-year degree at full sticker price through honest math, counting the cost, the four years of forgone earnings, the higher taxes on the higher salary, and the fact that money later is worth less than money today. It leaves the median graduate about $82,000 behind simply going to work. Run it again at the net price families actually pay and the median still loses, by less. About 79 percent of four-year schools leave their median graduate worse off at full price. About 30 percent fail to beat the high school path even if college were free.[15] A strong major at a low price still wins, sometimes by a fortune. The gap between the good bets and the bad ones is the whole point, and most schools at most prices sit on the wrong side of it. The method behind those numbers, net present value after costs and taxes, is the one I lay out in my book. And by a plainer measure across all of higher education, certificate and two-year programs included, at more than a quarter of all schools a majority of former students earn less than a typical high school graduate six years after they enroll.[15]
Same dollars, same decade of life, opposite compounding. One purchase builds equity with borrowed money. The other, at most schools and most prices, consumes the principal.
The claim here is about the typical degree at the price families actually pay, and at most schools that investment lost money at exactly the age when wealth compounds the hardest.
The parents paid twice
The drain did not stop with the students.
Paying for a kid’s college can easily cost a family $50,000 or more, and it lands squarely in the parents’ peak wealth-building years. To cover it, some parents delay retirement, pause investing, or borrow against their 401(k)s. A growing number reached for Parent PLUS loans, which for years let parents borrow up to the full cost of attendance, minus other aid, with no dollar cap. Congress capped new loans starting in July 2026, after a decade of unchecked growth had already done its work.[16] Parent PLUS balances grew from $65 billion in 2014 to $112 billion in 2023.[17] In 2024, about 3.5 million Americans aged 60 and older still carried student debt, more than $125 billion of it. Most of them owe for their own schooling, but some borrowed to help a family member through college.[18]
The flows do not tell us what any one family decided, but they all point one way. Money a household sends to a bursar out of its peak earning years is money it cannot put toward a bigger house, and a parent still paying off a Parent PLUS loan at 64 is not done paying for a degree someone else earned. The money flows are enormous.
The usual suspects are downstream
The standard explanations are not wrong. They are downstream.
The housing shortage is real, about 3.7 million missing units by Freddie Mac’s estimate. But supply explains the price of the house, and a thought experiment shows what it cannot explain. Build every missing unit tomorrow, and the young household with $39,000 in net worth and a loan payment attached still brings less to the closing table and qualifies for a smaller mortgage than it would without the loan. Hand that household a down payment instead, and with supply unchanged, prices spike. An overnight windfall moves prices. Money arriving slowly, at the pace the student debt built up, gives builders time to answer it where local rules let them. Supply sets the price. It does not explain why a 35-year-old shows up with a thin savings account.
Later marriage gets blamed, but the arrow can point the other way, with the inability to afford a home delaying marriage. Most likely it runs in both directions, which is exactly why later marriage cannot carry the story on its own. The tale of a generation that simply prefers renting has never persuaded me. And the viral chart, the most shared explanation of all, mostly measures who answers a mail survey.
Each of these is a piece. What ties them together is the same missing ingredient. By 2014, a generation of young adults carried about twice the student debt per person that young adults carried in 2005, and the Fed’s own estimate ties a little over a fifth of their drop in homeownership to that debt.[10]
I am not claiming college is the only cause, or that college is a bad idea. The right degree at the right price is one of the best investments a person can make. The claim is narrower and harder to dodge. We spent 40 years treating college as a riskless investment no matter the school, the major, or the price, and the bill for that mistake arrives on a long delay, as thin down-payment accounts at exactly the age when first homes are usually bought.
The fix starts upstream
If the wealth got diverted upstream, that is where the repair has to start, and it is cheaper than it sounds.
Make the math visible. Every program that takes federal aid should have to show its real return, after costs, taxes, lost earnings, and time value, right next to the plain alternative of going to work. Families comparing options deserve the kind of plain disclosure other investments are required to make.
Tie the new Parent PLUS limits to what graduates of that specific program actually earn, rather than a flat cap, so the government stops lending parents into their retirement to fund degrees that will not earn enough to repay the loans. And fund the off-ramps, the apprenticeships, the certificates that pay, the two-year paths into fields that are hiring, so that going straight to work is a respected choice instead of a confession of failure.
None of this lowers a home price tomorrow. But it slows the upstream leak that has been draining the next generation of buyers for two decades. The most surprising place to begin fixing the housing crisis may be the financial-aid office.
The viral chart says American homebuyers got old. Check it honestly and it mostly says one survey got old. What went wrong is younger and quieter, sitting in the balance sheet of the household that should be buying its first home this year and cannot. We did not simply run out of houses. We ran two decades of down payments through the bursar’s office first, and we are only now counting what that cost.
Reference Sources
- National Association of Realtors. “First-Time Home Buyer Share Falls to Historic Low of 21%, Median Age Rises to 40.” National Association of Realtors, 2025. Accessed June 15, 2026. Reporting the first-time-buyer median age of 40, the repeat-buyer median age of 62, the all-buyer median of 59, the 21 percent first-time share, and the survey methodology (173,250 questionnaires mailed, 6,103 responses, 3.5 percent response rate).
- U.S. Census Bureau. “America Is Getting Older.” U.S. Census Bureau, 22 June 2023. Accessed June 15, 2026. On the national median age reaching 38.9 in 2022.
- Mather, Mark, and Paola Scommegna. “Fact Sheet: Aging in the United States.” Population Reference Bureau, 9 Jan. 2024. Accessed June 15, 2026. On the median age rising from 30.0 in 1980 to 38.9 in 2022 (Census Bureau data).
- Michel, Norbert J., and Jerome Famularo. “First-time Homebuyer Crisis: Fact or Fiction?” Cato Institute, 3 Sept. 2025. Accessed June 15, 2026. Comparing NAR’s first-time buyer series against the Census American Housing Survey, which holds at 33, and AEI Housing Center loan-level data showing most first-time buyers under 34 from 2018 through 2024.
- O’Brien, Connor. “No, the median American homebuyer is not 59 years old.” Regions (Substack), 24 Nov. 2025. Accessed June 15, 2026. Analyzing American Housing Survey and American Community Survey microdata, finding the median recent buyer near 41 and estimating NAR’s overstatement at 15 to 20 years for all buyers and 5 to 10 years for first-time buyers.
- Federal Reserve Bank of New York. “Quarterly Report on Household Debt and Credit.” Federal Reserve Bank of New York Center for Microeconomic Data, 2026. Accessed June 15, 2026. For outstanding student loan balances of $240.7 billion in the first quarter of 2003 (the start of the series) and $1.658 trillion in the first quarter of 2026. The New York Fed cautions that 2003 and 2004 balances may be undercounted, which would make the increase look larger than it was.
- U.S. Census Bureau and U.S. Department of Housing and Urban Development. “Median Sales Price of New Houses Sold for the United States (MSPUS).” FRED, Federal Reserve Bank of St. Louis, 2026. Accessed September 28, 2026. About $410,700 in the second quarter of 2026.
- Freddie Mac. “Housing Supply: Still Undersupplied by Millions of Units.” Freddie Mac Research, 26 Nov. 2024. Accessed September 28, 2026. Estimating the shortage at 3.7 million units as of the third quarter of 2024.
- Federal Student Aid, U.S. Department of Education. “Federal Student Loan Portfolio.” Federal Student Aid Data Center, 2026. Accessed September 28, 2026. From the page’s Portfolio Summary, for the federal portfolio of about $1.72 trillion ($1,724.5 billion in principal and interest) and roughly 42 million borrowers (42.3 million recipients) at the end of June 2026. Federal Student Aid counts the student a loan paid for, so a Parent PLUS loan is counted under the student. The total is drawn from the Department’s National Student Loan Data System and runs above the New York Fed total in note 6.
- Mezza, Alvaro, Daniel Ringo, Shane Sherlund, and Kamila Sommer. “Student Loans and Homeownership.” Finance and Economics Discussion Series 2016-010r1, Board of Governors of the Federal Reserve System, June 2017 (later published in the Journal of Labor Economics, 2020). Accessed September 28, 2026. On the effect of about 1.5 percentage points per $1,000 of debt, “equivalent to an average delay of 2.5 months in attaining homeownership.” Also Mezza, Alvaro, Daniel Ringo, and Kamila Sommer. “Can Student Loan Debt Explain Low Homeownership Rates for Young Adults?” Consumer & Community Context, Board of Governors of the Federal Reserve System, January 2019. Accessed September 28, 2026. On “a little over 20 percent” of the 2005 to 2014 decline among household heads aged 24 to 32, and student debt as “an important factor … but not the central cause of the decline.”
- Federal Reserve. “Changes in U.S. Family Finances from 2019 to 2022: Evidence from the Survey of Consumer Finances.” Board of Governors of the Federal Reserve System, 2023. Accessed June 15, 2026. Median net worth for households under 35.
- Albanesi, Stefania, Giacomo De Giorgi, and Jaromir Nosal. “Credit Growth and the Financial Crisis: A New Narrative.” National Bureau of Economic Research, Working Paper 23740, 2017. Accessed June 15, 2026. Finding that “the rise in mortgage defaults during the crisis was concentrated in the middle of the credit score distribution, and mostly attributable to real estate investors.”
- Mian, Atif, and Amir Sufi. “House Prices, Home Equity-Based Borrowing, and the US Household Leverage Crisis.” American Economic Review, vol. 101, no. 5, 2011. Accessed June 15, 2026. Finding home-equity extraction accounted for at least 39 percent of new defaults from 2006 to 2008.
- Consumer Financial Protection Bureau. “12 CFR 1026.43, Minimum standards for transactions secured by a dwelling.” Accessed September 28, 2026. “A creditor shall not make a loan that is a covered transaction unless the creditor makes a reasonable and good faith determination at or before consummation that the consumer will have a reasonable ability to repay the loan according to its terms.”
- College return figures (the median NPV comparison, the institution distribution, and the share of all-higher-education schools where a majority of former students earn less than a typical high school graduate) are from the author’s own model. You can run any school and major at collegeroi.org.
- Federal Student Aid, U.S. Department of Education. “Frequently Asked Questions: Loan Limits.” 20 May 2026. Accessed September 28, 2026. The Parent PLUS limit is now $20,000 a year and $65,000 in all per dependent student. Parents who qualify for the interim exception can still borrow “up to the cost of attendance minus other financial assistance.”
- BestColleges. “What to Know About Parent PLUS Loans: 5 Startling Statistics.” BestColleges. Updated 15 Feb. 2024. Accessed June 15, 2026. Compiling U.S. Department of Education data on the rise from $65.1 billion (2014) to $112.2 billion (2023).
- National Consumer Law Center. “3.5 Million Older Americans Have Over $125 Billion in Student Loans.” National Consumer Law Center, 19 Sept. 2024. Accessed June 15, 2026.
Part of a series, The Debt Machine, on one idea: the way America finances college is a lending system with no underwriting, and it quietly drains household wealth before anyone connects the cause to the effect.
- The Viral Homebuyer Chart Is Wrong: the real drain on down payments is worse than the chart.
- Two Kinds of Debt: why the law makes mortgage lenders underwrite strictly and asks almost nothing of student loans.
- The Student Debt Fight Is About the Wrong Thing: both sides of the forgiveness debate miss the machine that keeps manufacturing the debt.
These essays extend the argument in my book on college return on investment. You can run the return on any school and major using the Explore ROI menu right here at collegeroi.org.