Last fall I watched a football game with a friend, and between plays he told me his daughter had found the perfect school. The right programs. Affordable. A strong track record of graduating its students and placing them in jobs. There was only one problem, he said. The acceptance rate. It was too high. Which meant, according to everything he had been told, not selective enough, not good enough. And the school’s leadership was apparently working on it.
That last part is the part that should bother you. Because the acceptance rate is not a standard a school meets. It is a number that falls out of arithmetic, and once you see the arithmetic, the whole ranking system built on numbers like it starts to look like what it is.
Acceptance rate is an output, not a standard
Harvard wants roughly 1,675 students in its freshman class. It knows from years of data that about 84 percent of the people it admits will actually enroll. So it works backward. To seat 1,675 students at an 84 percent yield, it has to admit about 2,000.[1] That number barely moves. Admit many more and the class overflows its dorms and its budget. Admit many fewer and the class comes up short.
Then the applications arrive. For the Class of 2029, the latest in Harvard’s fact book, 47,893 of them. Divide the roughly 2,000 admits by the 47,893 applicants and you get a 4.2 percent acceptance rate.[1] Harvard did not choose 4.2 percent. It chose a class size, inherited a yield, and received a pile of applications it mostly did not control. The rate is what the division spits out.
Look at what actually moves in that formula. Outside the pandemic years, the class size barely changes. The yield moves only a few points. The only number that swings is applications, and applications are driven mostly by forces no single school owns. The Common App lets a student send the same form to many schools, and the average applicant sent 6.8 in 2024-25, up 46 percent since 2015-16.[2] Test-optional policies spread during the same decade, and applications climbed faster once many schools on the Common App stopped requiring a score.[2] In my experience, global recruiting now reaches students who would never have heard of many American colleges a generation ago.
So applications surged, up 161 percent on the Common App since 2015-16, though the platform also grew from 625 to 1,097 member colleges in that time.[2] Harvard shows the arithmetic running both ways. Outside the pandemic year, its admit number stayed near 2,000, so its rate tracked the pile. Applications rose from about 39,000 for the Class of 2020 to more than 61,000 for the Class of 2026, and the acceptance rate fell from 5.4 percent to 3.2 percent. Then applications fell back to about 48,000 for the Class of 2029, and the rate climbed to 4.2 percent.[1] The class did not have to get weaker for the rate to rise. The pile got smaller.
Here is the tell. When the number of admits holds steady, a falling acceptance rate proves exactly one thing. More people applied.
But it does not prove the class got stronger. To know that, you would have to look at the quality of the students admitted, not the size of the rejected pile. A falling rate tells you little about the first. It fell mostly because the denominator grew while the number of seats stayed about the same. My friend’s daughter was being steered away from the right school by a number that tells you far less about quality than it seems to.
The formula was built to sell magazines
To understand how numbers like this one came to run the show, you have to go back to 1983, when U.S. News & World Report started ranking colleges. The editors needed to compare schools, and they could not measure educational quality directly, because quality is complex and messy and hard to put in a column.
So they did what publishers do. They reached for stand-ins that would produce a list readers found credible. The first editions were pure reputation, college presidents naming the schools they thought were best. By 1988 they added harder-looking data on admissions selectivity, faculty, resources, and graduation rates.[3]
The mathematician Cathy O’Neil, in her book Weapons of Math Destruction, notes that U.S. News was “a struggling newsmagazine” when it started ranking colleges, and that its editors hoped a college-ranking issue “might turn into a newsstand sensation.” Then she makes the point that matters most. She asks the reader to stand where the editors stood in 1988, building their first statistical model, and reconstructs their reasoning: if the cost of education went into the formula, “strange things might happen to the results.” Cheap universities “could barge into the excellence hierarchy,” and those surprises could sow doubts about the rankings.[4]
Read that plainly. On her reading, they left out what college costs because counting it might have made expensive schools look worse than affordable ones. The formula ended up protecting the prestige hierarchy instead of measuring value for the student. And by leaving cost out, she argues, it handed every college a quiet instruction: raise your prices, spend the money on the things we do measure, and rise.
Once the number became the target, schools gamed it
When a single number starts to drive prestige, and prestige drives enrollment, and enrollment drives revenue, institutions stop chasing the mission and start chasing the number. A well-documented case is Northeastern. In 1996 it sat at number 162 and its incoming president, Richard Freeland, decided to climb. He had his staff reverse-engineer the U.S. News formula and then worked it point by point.
When the formula rewarded small classes, he capped many sections at 19, just under the threshold for credit. When it rewarded selectivity, he pushed online applications to swell the applicant pool so the school could reject more of it and drop its acceptance rate. When it rewarded retention, he built new dormitories. When it rewarded reputation, he made a point of meeting every ranked president he could reach, to win better peer ratings.
Northeastern broke into the top 100 just as Freeland retired in 2006, and his successor carried it to number 49 by 2013. On his way out, the trustees voted Freeland a retirement supplement of about $2 million for his success.[5] The ranking rewarded every one of those moves, whether or not the education improved. When Money magazine instead scored schools in 2014 more on the value they delivered to students than on selectivity, Northeastern landed at number 433, at the bottom of the third quartile of Money’s list.[5]
The same logic turned against the safety school. Because acceptance rate long fed the ranking, schools had a reason to wait-list or turn away qualified applicants they expected to enroll somewhere else, a practice known as yield protection.[4][6] Wait-listing a strong student to protect a vanity statistic is indefensible as education and was rational as ranking strategy. U.S. News dropped acceptance rate from its formula in 2018, when it counted for 1.25 percent of the score.[6] But the number outlived the formula. My friend’s family still read it as a verdict on quality, and the school he told me about was apparently still working to lower it.
And when gaming the rules is not enough, some schools stretch them or break them.
Within about five years, a string of institutions was caught stretching or falsifying the numbers they fed U.S. News. Baylor paid admitted students to retake the SAT and handed out scholarships for higher scores, a practice its own faculty senate called “academically dishonest.” Iona misreported acceptance rates, graduation rates, test scores, and alumni giving for a decade, and inflated most in the categories U.S. News weighs. Emory reported the scores of admitted students instead of enrolled ones, and the admitted pool scored higher. George Washington reported that 78 percent of its new students had finished in the top tenth of their high school class, when the real share was 58 percent. Claremont McKenna’s own admissions dean fed inflated numbers for years.[6]
When a school got caught, U.S. News said in 2014, as Boston Magazine reported, that it might “un-rank” the school for a while if the false numbers moved its place on the list.[5] When the gain from years of inflated prestige dwarfs the cost of a temporary scolding, fraud stops being a scandal and becomes a business decision.
A ranking measures the assumptions inside it
Worse than the cheating is the way the number is built, on choices that could have gone another way. Change the formula and you change the winners. In the 2027 edition, the U.S. News national top 10 is entirely private and entirely elite: MIT, Princeton, Harvard, Yale, Caltech, Stanford, Penn, Duke, and a three-way tie for ninth among Johns Hopkins, Northwestern, and the University of Chicago.[7] Not one public university makes the cut.
Now score schools on what they do for ordinary students instead. Rank on access, affordability, graduation, earnings measured against what a college’s students would be expected to earn, and community and national service, the way Washington Monthly does, or on cost and outcomes, the way value guides do, and the hierarchy reorders.[7]
Some public universities that U.S. News ranks well outside its top tier rise sharply, while some famous private names slip. The University of Illinois Chicago sits at No. 95 among national universities in the 2027 U.S. News edition and at No. 49 on Washington Monthly’s 2026 list, which ranks 1,504 four-year colleges together, from research universities to small liberal arts colleges. Northwestern went the other way, from a tie at No. 9 in U.S. News to No. 79 on the combined list. Other famous names stay near the top, with MIT, Duke, Harvard, Princeton and the University of Chicago all in Washington Monthly’s top 10. Four public universities are there too: three Cal State campuses and the University of Texas Rio Grande Valley.[7] The same schools land in a different order, depending on which assumptions you bake into the formula. The difference between the two lists measures the formulas behind them. A ranking returns its own premises. Make a number the target and people serve the number, not the thing it was supposed to stand for.
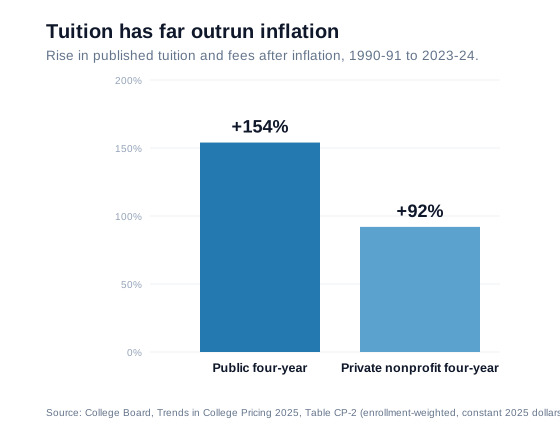
Chasing the ranking has a price, and it shows in what schools charge. Published tuition and fees at a public four-year school rose about 154 percent after inflation between the 1990-91 and 2023-24 school years, and at a private nonprofit one about 92 percent.[8] Those are increases on top of inflation. Rankings are not the only force behind that climb, especially at public colleges, where it was steepest. But the formula gave schools every reason to spend on the things it counts.
Part of that bill is paid with loans, and all federal student loans outstanding now total about $1.7 trillion.[8]
And the prestige some of that debt is buying may not be worth much. The economists Stacy Dale and Alan Krueger compared students with the same test scores who applied to the same caliber of schools. The ones who attended more selective colleges did not meaningfully out-earn the ones who attended less selective ones.[9] The selectivity premium, for the typical student in their study, is close to zero.
There is an exception, real enough to name. Students whose parents have less schooling do gain from a selective school, and Dale and Krueger find a similar pattern by parental income, though mostly short of statistical significance.[9] My reading, and my book’s, is that much of what makes that seat pay off runs through the price. The wealthiest of these schools cover a family’s full need, so a capable student with little money takes the seat for close to nothing, and a seat that costs close to nothing pays off at far lower earnings than one bought at full price. The gift follows talent and need, not any one background. For a family agonizing over a ranked school versus an affordable one, the financial case for prestige is weak unless the ranked school’s aid makes it the affordable one. I work through the odds behind cost, completion and field in another essay: College Is a Bet, and No One Shows You Your Odds.
The fix is transparency, not a better ranking
The answer is not a smarter formula. Reweight it and schools will simply game the new weights, because the problem is structural: no single ranking can hold something as varied as institutional quality and individual fit. The answer is to stop ranking and start reading the data directly, and it comes down to three moves.
Go program-level. You are not choosing a college, you are choosing engineering at one school or nursing at another. A school ranked tenth can have a mediocre program in your field, and one ranked seventy-fifth can have an excellent one. The federal College Scorecard publishes graduation rates for each college and, for each program, the earnings and debt of graduates who received federal aid, with earnings drawn from tax records.[10] It is free, and it is an outcome rather than a reputation.
Then add cost, the very thing U.S. News left out of its formula from the start. Run the net price calculator for every school on the list. Use the actual price your family will pay after aid, not the sticker.
Then weigh the expected earnings gain in your field, over what you would earn straight out of high school, against what you will spend to get it. By my model, a degree that costs $60,000 after aid and leads to a $60,000 salary four years after graduation roughly breaks even with going straight to work. One that costs $20,000 and leads to the same salary comes out ahead. That comparison tells you more than any ranking ever has.
Forty years of rankings made this decision feel harder than it is. The data exists, the tools are free, and the ranking that was doing your thinking for you was built to sell magazines. Run your own numbers instead. You can run them at collegeroi.org.
Reference Sources
- Harvard University Office of Institutional Research. “Fact Book: Admissions.” Harvard University, updated January 7, 2026. Accessed June 15, 2026. Class of 2029: 47,893 applications, 2,003 admitted, 4.2 percent admit rate and 83.6 percent yield, which implies roughly 1,675 enrolled. Class of 2020: 39,041 applications and a 5.4 percent admit rate. Class of 2026: 61,221 applications, 1,984 admitted, 3.2 percent.
- The Common Application. “First-Year Application Trends: 2024–25 End of Season Report.” The Common Application, Inc., 2025. Accessed June 15, 2026. Common App end-of-season report on application inflation: about 6.8 applications per applicant (up from 6.64) and roughly 10.2 million total applications. Since 2015-16, applications grew 161 percent and applications per applicant 46 percent, and member colleges rose from 625 to 1,097. Applications rose more sharply after 2019-20, which the report calls concurrent with many schools going test-optional.
- Myers, Luke, and Jonathan Robe. College Rankings: History, Criticism and Reform. Center for College Affordability and Productivity, March 2009 (ERIC ED536277). Accessed June 15, 2026. “The first three U.S. News rankings [1983, 1985, 1987] were entirely based on reputational surveys.” In 1988 U.S. News “reduced the reputational component to just 25 percent” and “determined the remaining 75 percent of a school’s score using objective input and output data such as admissions selectivity, faculty strength, educational resources, and graduation rates,” and began annual publication. See also “Infographic: 30 Editions of the U.S. News Best Colleges Rankings,” U.S. News & World Report, 9 Sept. 2014.
- O’Neil, Cathy. Weapons of Math Destruction: How Big Data Increases Inequality and Threatens Democracy. New York: Crown, 2016. Chapter 3, “Arms Race: Going to College,” on U.S. News leaving tuition and fees out of its ranking formula, and her reconstruction of why.
- Kutner, Max. “How Northeastern University Gamed the College Rankings.” Boston Magazine, 26 Aug. 2014. Accessed June 15, 2026. On Richard Freeland reverse-engineering the U.S. News formula. Also reports that in Money magazine’s 2014 value-based rankings Northeastern “landed at the bottom of the third quartile, at number 433.”
- On data misreporting and gaming across institutions, see: Anderson, Nick. “Five colleges misreported data to U.S. News, raising concerns about rankings, reputation.” The Washington Post, 6 Feb. 2013 (Bucknell, Claremont McKenna, Emory, George Washington, Tulane). On Iona: “Iona Admits Ex-Official Misreported Data to Outside Entities.” Inside Higher Ed, 8 Nov. 2011 (an outside review found a “consistent pattern of overstating student data” for a decade, beginning in 2002, covering acceptance and yield rates, SAT scores, graduation rates, and alumni giving). On Emory: “Emory Misreported Admissions Data for More Than a Decade.” Inside Higher Ed, 19 Aug. 2012. On Claremont McKenna: “Claremont McKenna Inflated SAT Scores for Rankings.” Inside Higher Ed, 30 Jan. 2012 (dean of admissions inflated reported SAT scores for six years). On Baylor: “Baylor Pays Freshmen to Raise SAT Scores.” Baptist Press, 2008 (bookstore credit to retake the SAT plus $1,000 scholarships for higher scores). All accessed June 15, 2026. On George Washington: Jaschik, Scott. “Another Rankings Fabrication.” Inside Higher Ed, 8 Nov. 2012 (GW reported 78 percent of new students in the top 10 percent of their high school class when the actual share was 58 percent). On acceptance rate leaving the formula: “U.S. News & World Report Announces 2019 Best Colleges Rankings.” PR Newswire, 10 Sept. 2018 (acceptance rate, previously weighted 1.25 percent, dropped from the methodology altogether). On yield protection: Drozdowski, Mark J. “Is Yield Protection Real?” BestColleges, updated 23 Apr. 2024 (former admissions officers describe wait-listing strong applicants who seem unlikely to enroll). These three accessed September 24, 2026.
- On the U.S. News list: Bleizeffer, Kristy. “U.S. News Best Colleges Ranking 2027: MIT Ends Princeton’s Long Run At The Top.” Poets&Quants for Undergrads, 23 Sept. 2026. Accessed September 24, 2026. Prints the 2027 national universities top 10 with each school’s 2026 rank, and the 2026 and 2027 ranks of the biggest movers. On Washington Monthly: “A Note on Methodology: Best Colleges for Your Tuition (and Tax) Dollars.” Washington Monthly, 30 Aug. 2026. Accessed September 28, 2026. Rankings of 1,504 four-year colleges built in equal parts on access, affordability, outcomes (graduation and earnings against prediction), and service. The ranked list: “2026 Best Colleges for Your Tuition (and Tax) Dollars.” Washington Monthly, 2026. Accessed September 28, 2026.
- College Board. Trends in College Pricing 2025, Excel data, Table CP-2. College Board, October 2025. Accessed September 24, 2026. Enrollment-weighted published tuition and fees in constant 2025 dollars: public four-year $4,710 in 1990-91 and $11,950 in 2023-24, up about 154 percent, and private nonprofit four-year $23,010 and $44,110, up about 92 percent. The student debt total is from the U.S. Department of Education’s Federal Student Aid Portfolio Summary: $1,724.5 billion outstanding in federal student loans in the third quarter of fiscal year 2026. Accessed September 24, 2026.
- Dale, Stacy, and Alan Krueger. “Estimating the Return to College Selectivity over the Career Using Administrative Earnings Data.” NBER Working Paper 17159, National Bureau of Economic Research, 2011. Accessed June 15, 2026. The selectivity premium falls to near zero for the typical matched student, with meaningful gains for students from less-educated families and for Black and Hispanic students. The paper finds a similar pattern by parental income, though mostly not statistically significant (full paper, section V). The author reads the payoff from that exception as substantially the value of the near-free price well-endowed selective schools extend to talented admits from families with little money, a gift that follows talent and need rather than any one background. On the price itself, Harvard says it builds each aid package “to meet all of your demonstrated need” and that “For families with annual incomes below $100,000, the expected parent contribution is zero” (How Aid Works, accessed September 24, 2026), and Yale says “all admitted students receive aid that meets 100% of that need” (Financial Aid Policies, accessed September 24, 2026).
- U.S. Department of Education. “College Scorecard.” U.S. Department of Education. Accessed June 15, 2026. Graduation rates by college, and earnings and debt by program for graduates who received federal grants or loans. Program earnings come from IRS tax records linked to federal student aid records: “Technical Documentation: College Scorecard Data by Field of Study.” U.S. Department of Education, September 2025. Accessed September 24, 2026.