Sooner or later, every argument about college prices arrives at the podium. By the podium I mean the winners’ stand: the short list of famous colleges where today’s CEOs, senators, and judges went to school. Somebody points to that list, and the numbers behind it are real.
Twelve colleges, the eight Ivies plus Stanford, MIT, Duke, and Chicago, enroll less than half of one percent of Americans. Those same twelve account for more than 10 percent of Fortune 500 CEOs, a quarter of United States senators, and three-fourths of the Supreme Court justices appointed in the last half-century.[1] That is the podium.
I did not pull those numbers from a brochure. They are the opening page of the most important study of elite colleges in a generation, by Raj Chetty, David Deming, and John Friedman. It is the best evidence anyone has that getting in does something for the students who get in, beyond who they already were.[1]
This is the second landmark study on the question. More than twenty years ago, two economists, Stacy Dale and Alan Krueger, compared students who were accepted by similar colleges and chose different ones. They found that for the typical student, the famous name made no measurable difference to later earnings. I read their paper all the way through when I wrote about it, and I read this one the same way. I wanted to know exactly what it measures and exactly what it leaves out.
Here is what I found, in four steps. What the podium statistic actually measures. What the study found. Where the price of the seat went. And what to say when the statistic lands on your family’s table.
The statistic answers a question no family asks
Start with the statistic. It answers this question: of the people who became CEOs, where did they go to college?
A family needs the opposite question answered. If my child goes to one of these colleges, what are her chances?
Those two questions sound alike and have very different answers. It is the difference between asking which store sold the winning lottery ticket and asking what your own ticket’s odds are. A store can sell a lot of winners because of who shops there. That count cannot tell you whether buying there improves your ticket. The whole argument turns on that difference.
Think of a championship basketball team. Measure the players and you will find they are all tall. Nobody concludes that the coach makes people tall. The team picked tall players. The podium statistic works the same way. It counts who was let in. It does not tell you what happened to them afterward.
Here is why the podium was always going to look this way. There are only five hundred Fortune 500 chairs. The country hands out about two million bachelor’s degrees a year.[2] So almost nobody wins. A school that picks the most ambitious half of one percent of students will supply far more than half of one percent of the winners, whatever it teaches. The schools did not have to add anything to those students for the podium to look this way. Picking well would do it. That tells you who those schools let in. It does not tell you what the schools did for them.
The study’s authors say something the podium argument never quotes. Even if you changed who gets into these colleges, the country’s top earners would look about the same. Their reason, in their own words, using the study’s name for these twelve schools: Ivy-Plus attendees “account for a relatively small share of individuals who reach the top of the income distribution.”[1]
Most people who reach the top never went to one of these twelve schools. The schools are over-represented on the podium, but they are still a small slice of everyone who gets there.
They test that with a concrete example. Rich students get three admissions boosts at these colleges: preference for the children of alumni, recruitment for athletes, and more polished applications. Take all three away, and more students from ordinary families would get in. Follow the effect through to the Fortune 500, and the share of CEOs who come from families outside the richest 5 percent would move by four-tenths of one percentage point.[1] On a list of five hundred, that is two names. The number is small because the schools are a small part of where CEOs come from. Even a big change in who they admit is a small change in the whole. Change the gate, and the podium barely notices.
So the podium is real, but it is a poor lever. It tells you these schools admit people who tend to end up on top. Whether the schools cause that is a different question, and it is the one the next section answers.
One caution. The people in the study are 33, an age at which almost nobody is yet a Fortune 500 CEO or a senator. So the study cannot count how many of them became leaders. What it can see at 33 is who earns in the top 1 percent, who went to an elite graduate school, and who works at a prestigious firm. From those it projects who is likely to reach leadership later. That is a fair method. It also means the study’s claims about what the seat does to your child’s odds of becoming a CEO are forecasts, not counts. The podium statistic at the top of this piece is a count of today’s leaders. The study’s estimate of what the seat does to your odds of joining them is not.[1]
So how much of the podium is who walked in, and how much is the seat? That is the question the study was built to answer.
Half the podium is who walked in
Here the study did something new. Picture two students with equally strong applications to the same elite college. Both are put on the waitlist. In July, one gets the call. The other does not, and goes to a strong public flagship, the big state university a good student can get into from anywhere in the state.
Why does that pair matter so much? Because colleges take students off the waitlist as seats open up, and which waitlisted students get those seats has little to do with the differences between them. Once the applications look the same, which one got the call is close to a coin flip. A coin flip is exactly what you need to measure an effect, because it separates what the seat did from who the student already was. Follow both students for ten years and compare them, and you get about as clean a measure of what the seat does as anyone has managed.
The answer? About half. Take the gap between these colleges and the flagships in how many students reach the top 1 percent of earners. Roughly 51 percent of that gap is explained by who enrolls.[1] In plain terms, if you kept the schools and swapped the students, about half the gap would follow the students. The other half is what the seat itself does. That half is real, and it deserves to be taken seriously.
Go back to the championship team. Suppose you want to know how good the coach really is. Comparing his team with an ordinary team tells you nothing, because he recruited the best players. You need a third number: how those same players would have done under an ordinary coach. The study estimates exactly that.
Count everyone who attends, rather than only the students off the waitlist. Out of every 100 students at a flagship, about 7 reach the top 1 percent of earners by age 33. Out of every 100 students at these twelve colleges, about 19 do. But had those same 100 gone to a flagship, about 13 would have made it anyway.[3] The recruiting explains the step from 7 to 13. The coaching explains the step from 13 to 19. So the seat itself lifts about 6 students in 100 into the top 1 percent. The other 81 do not get there from either school, and they are the students the averages hide.
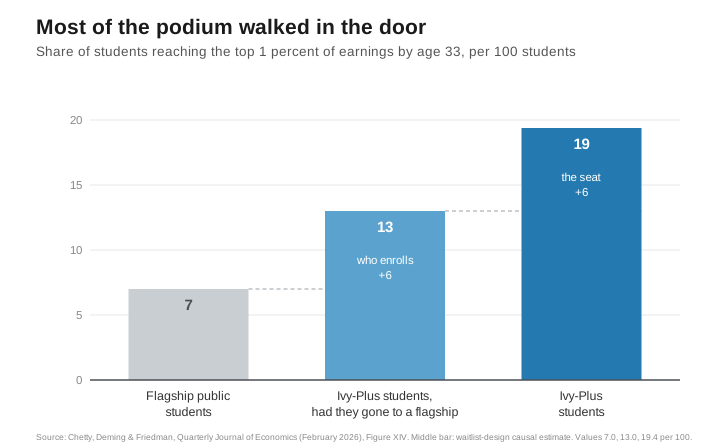
The middle bar is the one the podium argument never mentions.
The study also settles an old argument. The things that get rich students in, alumni status, an athletic slot, glowing ratings for non-academic qualities, predict nothing good about how those students do afterward.[1] The thumb on the scale gets them through the door. It does nothing for them once they are inside.
Where the other half shows up
The seat’s effect is real. Now ask what it actually changes.
It changes the odds of a rare outcome: earning in the top 1 percent, a small group of very high earners. It does not measurably change the ordinary outcome, reaching the top quarter of earners, which is where a good salary and a secure career live.
Some families want the long shot, and they can afford to chase it. If the bet misses, they absorb the loss and life goes on.
Most families cannot take that risk. What they need is the ordinary outcome: a good, steady income they can count on, with the chance of more as a bonus. That is the finding families most need to hear, because the seat does not move the ordinary outcome. It moves the odds of the jackpot.
Take the borderline student, the one who barely got in. Going to one of these colleges instead of a flagship raises that student’s chance of reaching the top 1 percent of earners at age 33 by about half. It roughly doubles the odds of getting into an elite graduate school. It roughly triples the odds of working at a prestigious firm.[4] Now take the result most families would actually call success: reaching the top quarter of earners. There the study finds no effect it can measure.
The authors also re-ran Dale and Krueger’s older comparison inside their own data. They found what Dale and Krueger found: for the typical student, at most a modest gain in ordinary earnings.[4]
Two studies, two methods, two decades apart, one answer for the student in the middle. The seat does little for that student. It does something real to the odds of a jackpot.
Keep the jackpot in proportion. Look again at the 100 students. Thirteen would have reached the top 1 percent from a flagship. Nineteen did.[3] That is 6 more students out of every hundred. It is also a 50 percent improvement, because 6 is about half of 13. Both statements are true. One sounds like a lot. The other sounds like what it is. The odds went up by half, and the student still misses about four times in five.
The study’s most quoted number is that attending lifts average earnings at 33 by $101,000. The number is correct. But it is an average, and an average gets pulled up by a few huge outcomes. Picture the average income in a diner the moment a billionaire sits down at the counter. Everyone else’s income did not change. The authors show the same thing in their own data. That $101,000 is driven by the few students who land at the very top, not by a raise shared by everyone. The effect at the top 1 percent is about six times what an even raise for every student would produce.[3] So if your child is a typical admit, the honest expectation is not the average. It never is.
For contrast, take the school I went to, Baruch College in New York. I should say that I now chair the Baruch College Fund’s campaign committee. I did not when I wrote the model behind these essays, and nothing in this piece depends on it. In the same research group’s public data on every college in the country, about 4 of every 100 Baruch students reach the top 1 percent by their early thirties, against about 18 at the twelve Ivy-Plus colleges.[5] That data covers a different group of students, which is why the figure is 18 here and 19 above. Those are simple counts, and they reflect who each school admits: Baruch takes 28 of every 100 students from the poorest fifth of families, Harvard takes 3.
But look at the ordinary outcome. About half of Baruch’s students reach the top fifth of earners. At Harvard it is about two-thirds. The jackpot column is where the schools differ. The good-income column is much closer than the podium would ever suggest.
Count the misses
Now count the misses, because every number so far has been a hit rate.
At these twelve colleges, 81 of every 100 students do not reach the top 1 percent by 33. Send the same students to a flagship and 87 do not. That is what the seat buys: six fewer misses in a hundred.
And the top 1 percent is the easier prize. The podium counts Fortune 500 chairs, and there are only five hundred of them. The study never follows anyone to a CEO’s office, so here is my own rough arithmetic. It is a headcount, not an experiment. Count the chairs, count the classmates, divide. Wherever I had to round, I rounded toward the famous schools.
A chief executive stays about seven years, so about 70 chairs open up in a typical year.[6] One in eight goes to a graduate of these twelve colleges, which is about 9 chairs.[1] About 20,000 students start at those colleges every year. Nine chairs, twenty thousand students.
That is 4 or 5 graduates in every 10,000. The other 9,995 or so never sit in one. For graduates of every other college, it is a handful in 100,000. Plenty of those graduates never wanted the job, so the odds for someone who truly tries are better than this. That is true at every college.
So yes, the famous schools’ odds are better, more than fifteen times better, and that raw gap includes who they admit, not only what the seat does. Both numbers are still lottery odds. The school changes the odds. It does not change the fact that the ticket almost always loses.
What the seat really opens
One more thing about those tripled odds, before they impress anyone at your table. In the study, a prestigious firm means a firm where an outsized share of these twelve colleges’ graduates go to work.[1] So the measure leans toward these colleges by the way it is built. The authors checked that list against outside rankings. It is the firms you would guess.
Here the coach comparison needs one correction. A great coach makes his players better. What these colleges mostly add is something else: more scouts at the games. About 25 of every 100 students land at one of these firms, against about 7 had the same students gone to a flagship.[3] That is the biggest jump in the study, and it happens at the hiring door. Meanwhile the typical graduate’s place in the national earnings line barely moves: around the 81st percentile from these colleges, and the same for those students had they gone to a flagship.[3] Nothing in the study shows the players got better. What it shows is more scouts in the stands.
Here is why. The big consulting firms, banks, and law firms on that list recruit heavily at a short list of famous campuses. They let the admissions office do the screening for them. If you got in, they assume you are good. That is the same shortcut the family is buying: pay for the name, and doors open. Those odds come from that habit on the employer’s side. They do not measure what your child can do. They measure where the recruiters go.
I saw this from the inside. I got to McKinsey from Baruch, a commuter college in Manhattan, and from the business school at Indiana University, a public flagship of exactly the kind this study compares the famous colleges against. From day one, the firm treated me exactly like my colleagues with famous diplomas. Getting in the door was harder for me. Once inside, the work and the career were the same. If employers looked past the name, the graduate would be the same person. Only the odds of being noticed would change.
So far, two findings. Half the podium is who walked in. The other half shows up mostly at the very top of the earnings range and at the doors of famous firms. Now the part I keep coming back to.
The price is not in the paper
Nowhere in the paper does the price of the seat appear. The earnings are before tax, straight off the tax forms. Nothing in the study subtracts tuition. Nothing counts financial aid against it. And nothing adjusts for time. If I offer you $100 today or $100 in thirty years, you take it today, and any investor would tell you the far-off $100 is worth much less. A dollar earned at fifty is worth less than a dollar paid at eighteen. The study never makes that adjustment for the family. That is not carelessness. It is how this research is done, and Dale and Krueger drew the same line.[7]
But the paper makes one exception, and it is the most revealing part of the appendices. When the authors work out what these colleges are worth to the federal government, the math suddenly gets serious. They apply a 30 percent tax rate to the extra earnings. They shrink every future dollar back to what it was worth at age 19, at 3 percent a year, which is exactly the time adjustment the family never got. They conclude that each student who attends produces $615,000 in extra tax revenue, in today’s dollars, for the Treasury.[8]
Read that again. The one investor in the paper who gets careful, after-tax, time-adjusted math is the government. The family, the one actually writing the check, gets a before-tax snapshot at age 33. The study does not answer what the seat is worth to the person paying for it. Its own appendix shows the authors know exactly how to answer that question.
Someone sharp will flip that number around, so let me do it first. If the government’s 30 percent slice of the gain is worth $615,000, the other 70 percent, the student’s part, works out to about $1.4 million. Does that settle it in prestige’s favor? No. Here is why. That $1.4 million is an average across thousands of students, and we just saw that the average is carried by a few huge winners while the typical student barely moves. The government collects from every student at once, so it really does get the average. That is how a casino makes money: it plays every hand at the table, so the averages work for it. Your family is not the casino. You have one child and one draw. An average built on jackpots is not what a typical ticket pays.
So run the family’s version of the math, the version I have been running for years. Here is what is actually for sale.
- For the typical admitted student, at most a modest gain in ordinary earnings. That is the study’s own re-run of Dale and Krueger.
- About 6 more chances in 100 at a jackpot. Real, but small.
- A bigger jump in the odds of landing at a famous employer, which comes from the recruiting habit above and not from any change in your child.
- And the price: often six figures more over four years than the alternative, paid at sticker, with money your family has already paid tax on, up front, at the age when money has the longest time to grow anywhere else.
That is not an investment. That is a lottery ticket with a very fine printer.
The one buyer for whom the math flips
There is one buyer for whom the math genuinely flips, and the study names them: students with weak fallback options, meaning the college they would otherwise attend sends almost nobody to the top.[1] For them the seat changes the most, because the alternative offers the least.
And here the prestige machine contains its one great mercy. These are exactly the students the elite colleges charge the least. All twelve advertise that they meet full financial need, each by its own definition of need.[9] The school decides what your family can afford, and the schools do not all decide it the same way. But for a talented student from a family with little money, the answer is usually close to free. That student collects the largest measured benefit at close to the smallest price, and the math says take the seat without hesitation. I said the same thing when I priced out Dale and Krueger, and this study strengthens the advice. The prestige premium is a gift precisely when it is given away.[7]
What to say at the table
Which returns us to the dinner table, where the podium statistic is usually deployed against a family deciding whether to pay full price. You can now answer it in three sentences. The podium counts winners after the toughest admissions filter in the country has already run, and the study behind the statistic says changing that filter would barely change who ends up at the top. Half the gap is the students themselves, and for the typical student the earnings difference is modest at most. What is left is a real but small improvement in lottery odds, which the study prices carefully for the Treasury and never for you.
The check still might say go. If the aid package makes the seat cheap, the odds come nearly free, and cheap odds on a real lottery are a fine thing to own. The habit that gets you to that answer has two steps, in that order. Open your options first: the famous school, the flagship, the school down the road, every offer with its real price attached. Then run your numbers on each one. The famous schools have wonderful graduates, and so does the school down the road. You learn which offer pays by pricing the one in front of you, not by counting justices. You can have your dream. Do not overpay for it. The podium tells you where the winners have been sitting. It has never once told a family what a seat should cost.
Companion Pieces
- What the Prestige Study Left Out
- College Is a Bet, and No One Shows You Your Odds
- A Degree Is Not a Treasury Bond
- Compared to What?
Reference Sources
- Chetty, Raj, David J. Deming, and John N. Friedman. “Diversifying Society’s Leaders? The Determinants and Causal Effects of Admission to Highly Selective Private Colleges.” Quarterly Journal of Economics, February 2026. Circulated as NBER Working Paper 31492 (July 2023, revised August 2025). Figures verified against the August 2025 version. Accessed July 6, 2026. Figure I base rates: under 0.5 percent of Americans, over 10 percent of Fortune 500 CEOs, 25 percent of senators, 75 percent of Supreme Court justices appointed in the last half-century. “Relatively small share” quotation and the 0.4 percentage-point CEO result from Section 6. Selection share (51 percent) and credential-outcome correlations from Figure XIV and Section 5. Leadership outcomes extrapolated from early-career proxies (Section 6). Prestigious-firm definition: firms accounting for 25 percent of Ivy-Plus employment by revealed preference, residualized on predicted pay, validated against Vault rankings (Section 2.3). Heterogeneity by fallback options, Section 4.
- National Center for Education Statistics. “Fast Facts: Degrees Conferred.” U.S. Department of Education. Accessed July 6, 2026. Postsecondary institutions conferred 2.0 million bachelor’s degrees in 2021-22.
- Chetty, Deming, and Friedman. Figure XIII: mean income at age 33 of $244,000 (Ivy-Plus) versus $143,000 (flagship attendees reweighted to Ivy-Plus characteristics), difference $101,000. The top-1-percent effect is six times larger than a constant proportional shift would predict. Figure XIV, “Earnings in Top 1%”: observed share of 19.4 percent for Ivy-Plus attendees and 7.0 percent for flagship attendees, with an implied 13.0 percent had the same Ivy-Plus students attended state flagships (gain of 49 percent). “Work at Prestigious Firm”: 24.7 percent observed, 7.1 percent implied had the same students attended state flagships, and 4.0 percent for flagship attendees (gain of 245 percent). Mean income rank: 81.2 observed, 81.5 implied, and 75.7 for flagship attendees (gain of 0 percent).
- Chetty, Deming, and Friedman. Waitlist design: raw effect of 5 percentage points on top-1-percent earnings at age 33 (Figure VIIIa, p < 0.05), from about 14 in 100 for waitlist rejects to about 19 for waitlist admits, a gain of about 35 percent on that base. The 49 percent figure below is the flagship-rescaled estimate in Figure XIV, which is the basis the body uses. Summary causal magnitudes: top 1 percent +49 percent, elite graduate school +92 percent, prestigious firm +245 percent (Figure XIV. The abstract states “almost triples,” and the introduction states 2.5 times for the marginal student). Top-quartile effect “small and statistically insignificant.” Matriculation-design replication “implies modest impacts… on log earnings, consistent with the findings of Dale and Krueger (2002).”
- Chetty, Raj, John N. Friedman, Emmanuel Saez, Nicholas Turner, and Danny Yagan. “Mobility Report Cards: Income Segregation and Intergenerational Mobility Across Colleges in the United States.” Quarterly Journal of Economics 135, no. 3 (2020), with the college-level data table mrc_table2 published by Opportunity Insights. Accessed September 14, 2026. Students born 1980 to 1982, incomes measured in 2014 at ages 32 to 34. Share reaching the top 1 percent of their cohort: CUNY Bernard M. Baruch College 3.6 percent, Harvard 21.1 percent, the Ivy-Plus tier 18.4 percent weighted by enrollment. Share reaching the top fifth: Baruch 52.2 percent, Harvard 65.2 percent. Share of students from bottom-fifth families: Baruch 27.6 percent, Harvard 3.0 percent. Raw shares, not causal estimates.
- Author’s arithmetic, a headcount and not the study’s estimate. Inputs: Chetty, Deming, and Friedman, Figure I, 12.5 percent of the 2024 Fortune 500 CEOs they could identify attended an Ivy-Plus college, against 0.8 percent of all college attendees, and Appendix N, 19,689 students in one Ivy-Plus class. Chen, Joyce, and Carol Jerotich. “CEO Tenure Rates.” Harvard Law School Forum on Corporate Governance, Equilar, August 4, 2023. Accessed September 21, 2026. Average S&P 500 CEO tenure of 7.2 years in 2022, used as a stand-in for the Fortune 500. The sums: 500 chairs over 7.2 years is about 69 openings a year, one in eight of which is about 9, and 9 in 19,689 is 4.4 per 10,000, or about 5 against the smaller classes of thirty years ago. For all other colleges, about 60 openings a year against 1.1 to 2.0 million bachelor’s degrees a year (note 2) is 3 to 6 per 100,000. The ratio of more than fifteen comes from the study’s own shares, 12.5 percent of chairs from 0.8 percent of students.
- Dale, Stacy Berg, and Alan B. Krueger. “Estimating the Payoff to Attending a More Selective College.” Quarterly Journal of Economics 117, no. 4 (2002): 1491-1527. And “Estimating the Effects of College Characteristics over the Career Using Administrative Earnings Data.” Journal of Human Resources 49, no. 2 (2014): 323-358. Pre-tax earnings outcomes, no cost, tax, or discounting adjustments. Selectivity null for the typical matched student. Full treatment in the companion essay “What the Prestige Study Left Out.” collegeroi.org, August 31, 2026.
- Chetty, Deming, and Friedman, Appendix N: 30 percent average marginal tax rate, 3 percent discount rate net of growth to age 19, $615,000 per-student net present value of additional federal tax revenue, $12.12 billion for the 19,689-student 2013 cohort.
- Financial-aid policy statements, all twelve institutions, verified against each school’s own published page on July 25, 2026. Harvard, “How Aid Works”: “we meet 100 percent of our students’ demonstrated financial need.” Yale, “Financial Aid Policies”: “all admitted students receive aid that meets 100% of that need, without loans.” Princeton, “Cost and Aid”: “Princeton will meet 100% of your demonstrated financial need with grant aid.” Columbia, “Undergraduate Financial Aid”: “Need-based. Need-blind. Full need.” Penn, “Financial Aid”: “meets 100% of demonstrated financial need with grants and work-study funding.” Brown, “Financial Aid”: “Brown meets 100% of each student’s demonstrated financial need.” Dartmouth, “Introduction to Financial Aid”: “Dartmouth will meet 100% of your demonstrated need.” Cornell, “Access and Affordability”: “Cornell meets 100 percent of demonstrated financial need for all eligible undergraduates.” MIT, “Student Financial Services”: “We meet 100% of an undergraduate’s demonstrated need.” Duke, “Financial Aid”: “Duke meets 100% of demonstrated need for undergrads.” Chicago, “No Barriers”: “We meet 100% of your family’s demonstrated financial need.” Stanford is the one that says the quiet part out loud, committing in its “Bulletin” to “meeting the University-computed financial need of each admitted student.” That is the reason the verb here is advertise. Every one of these schools promises to meet need in full, and every one of them decides for itself what your need is.