A new study of college value is making the rounds, and the people sharing it are calling it the end of the debate.
The Postsecondary Commission hired Mathematica, one of the most respected policy research firms in the country, to measure what enrolling in a Texas public college adds to a student’s earnings.[1] The researchers linked the school records, college records, and paychecks of hundreds of thousands of Texans. The headline finding: students who enrolled seeking a bachelor’s degree came out $86,806 ahead after fifteen years.
The posts write themselves. College pays. The skeptics should apologize.
I read all 126 pages. Here is what I found.
This is the best at-scale study of college value I have seen. I mean that without qualification. The authors fixed three of the flaws I have spent years documenting in the famous numbers. And the victory lap being run on its behalf still gets the study wrong, because the authors stopped at the halfway point. They measured the earnings difference with real care. They never ran the investment arithmetic. Run that second half on their own numbers and the comfortable headline becomes a conditional one: real value for many students, decided by program, completion, and price, and much smaller than $86,806 the moment you treat money the way money works.
Let me show you both halves.
The half they fixed
The numbers families usually get handed, the $1.2 million lifetime premium and its cousins, share three defects. They compare graduates to non-graduates without asking whether the two groups were similar to begin with. They count only the people who finished. And they ignore the years of earnings a student gives up while enrolled.
This study repairs all three. It compares each entering cohort to a matched group of similar Texans who did not enroll, matched on test scores, family income status, prior earnings, and even home county.[2] It counts every student who started, including the ones who never finished. And it starts the meter in the year of entry, so the earnings surrendered during the college years count against the degree.
Then the authors did something genuinely useful. They measured what happens when you skip the matching, the way the marketing numbers do. The answer: for students entering in 2008–09, the unmatched comparison inflated the bachelor’s earnings gain by a third. For associate’s degrees the inflation was 77 percent. For certificates it was 98 percent.[3]
Stop and absorb that. The most rigorous study on the pro-college side of the ledger, funded by the Gates Foundation and the ECMC Foundation, just priced the head start built into the famous numbers, what researchers call selection bias, at a quarter to a half of the claimed gain.[1]
Students who go to college would have out-earned their neighbors anyway. Comparing the two groups raw credits the college with what the student brought to campus. That argument used to get me called a cynic. It is now a finding, printed in the appendix of the study everyone is celebrating.
The half they skipped
So why not take the $86,806 at face value?
Because that number is a raw sum.
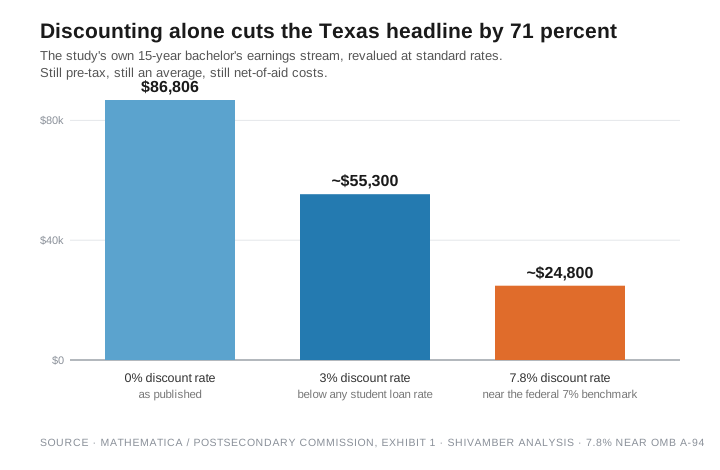
The study adds up earnings differences across fifteen years in inflation-adjusted dollars and reports the total.[4] A dollar received in year fifteen counts exactly the same as a dollar today.
No investor, no lender, no pension fund, no federal budget office treats money this way. For decades, the federal government’s own rule of thumb for judging investments was 7 percent a year after inflation, because that is roughly what private money earns elsewhere.[5] My model uses 7.8 percent, set near that benchmark, a choice I defend at length in A Degree Is Not a Treasury Bond.
I rebuilt the study’s year-by-year stream from its own Exhibit 1 and discounted it. At a 3 percent rate, friendlier to college than any student loan a family can get, $86,806 becomes about $55,300. At my 7.8 percent rate it becomes about $24,800, and the break-even point slides from year ten into year eleven.[6] Nothing about the study’s careful matching changes. Only the arithmetic the authors never ran.
The deflation does not stop there. The earnings in the study are pre-tax, straight from unemployment insurance wage records. The extra earnings a graduate makes are taxed, and the tax code takes a bigger bite of bigger paychecks, so graduates lose more to taxes than the workers they are compared against. A family keeps the after-tax difference, not the printed one.
The study is even gentler on the cost side. It subtracts tuition, fees, and books, net of every grant and waiver the student received, and nothing else.[7] To be fair, the authors make a defensible choice on room and board. People pay to live whether or not they enroll, and the researchers could not observe housing costs cleanly, so they left them out rather than guess. I accept that reasoning as far as it goes. But the study also counts every cost at face value, as if families paid cash. The family that borrows at today’s federal rates, 6.52 percent for undergraduates and up to 9.07 percent on parent loans, pays interest on every one of those dollars, and the interest is real money the study never sees.[8]
One more omission is worth naming, because the authors flag it themselves. The wage records miss employer benefits entirely, the health insurance and retirement money on both sides of the comparison.[9] Which way that cuts is less obvious than it sounds. Benefits go with the employer and the job, not the diploma. A union card, a military career, or a counter job at a chain known for generous benefits all come with packages no credential produced, and at a firm that employs both, the standard package does not check for a degree. Whatever benefits gap exists between the two matched groups is unmeasured, in size and in direction. Subtract taxes and the printed gap shrinks. Count benefits and nobody knows. My point is not that every correction cuts against college. My point is that nobody ran them.
None of these are exotic adjustments. Discounting, taxes, and the cost of borrowed money are what analysts apply to cash flows everywhere else in the economy. The study measured the gain well and then declined to price it.
An average is not the bet your family is making
There is a second, quieter problem with the headline, and you can see it in the shape of the curve.
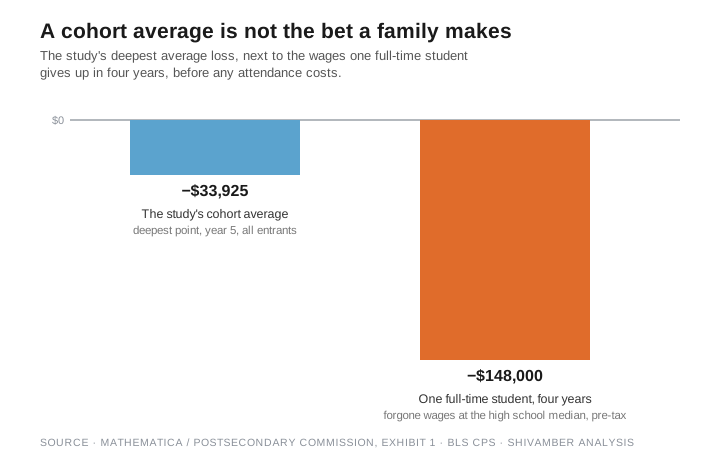
The study reports that the average bachelor’s entrant hit bottom five years in: down $33,925.[10] Read that as the cost of attending college and it sounds almost painless. Now compare it to the bet made by a student who enrolls full-time and does not work. Four years out of the workforce is roughly $148,000 in forgone earnings alone, before taxes and before the first dollar of attendance costs.[11]
How does a $148,000 bet produce a $34,000 dip in the data? Because the study’s number is a cohort average, and the cohort is not one family. The comparison group is eighteen-year-olds earning entry wages, not experienced workers. The enrolled students work part-time jobs and summers, and their earnings offset the gap. And a large share of the cohort dropped out early and went back to work, which pulls the average hole shallower every year. All of that is correct measurement of the group. None of it describes the exposure of one student who enrolls full-time, borrows, and stays the course. The average is a fact about Texas. Your decision is a fact about your kid.
The study’s exhibits show what the average smooths over. Liberal arts and social science majors were still underwater ten years after enrolling.[12] About a quarter of certificate-granting institutions delivered negative value even before discounting.[13] Students who entered from the bottom quarter of high school math achievement were, on average, $7,668 behind their non-college peers a full decade in.[14] The losing end of this range is not a rounding error. It is enrolled, it borrowed, and it is the population the accountability debate claims to protect.
And here the study hands families its most useful finding. Across every degree type, the number that tracked a cohort’s value was not the institution’s price or prestige. It was the share of students who finished. For bachelor’s cohorts, each additional point of completion went with about two thousand dollars more value per student, and the same pattern showed up for associate’s degrees and certificates at smaller amounts.[15] Program choice mattered more than institution choice. Which is to say: the study’s own findings put the risk where my book puts it. What you study and whether you finish show up in their analysis. What you pay is subtracted in their own definition of value. Whether college pays is settled by those three choices, not by enrolling.
The fine print the victory laps skip
Three boundaries, all disclosed by the authors, all missing from the posts.
The fifteen-year headline rests on a single entering class: 28,614 students who started in the 2008–09 year at 29 public universities, matched at a 64 percent rate.[16] Their earnings story runs from the financial crisis through the tightest labor market in decades. The authors show that later cohorts track a similar path through year fourteen, and the trade-off is structural, since a long window forces old data. Fair enough. But a 2026 applicant deciding at 2026 prices, in a labor market being rearranged in real time, is not the 2008 cohort, and honest uncertainty about that gap should run in both directions.
The study covers Texas public institutions only. The authors say plainly that private and for-profit colleges show more variable and more frequently negative returns, and they warn readers not to generalize.[17]
And the estimates are sensitive to a quiet assumption. Anyone absent from Texas payroll records counts as earning zero. Change only the rule for who counts as employed and institutional results move by anywhere from a fifth to nearly half.[18] The authors report the swing themselves. It is the honest disclosure of a real fragility.
What the best study yet proves
Here is the state of the argument after this study, as I read it.
The uncontrolled marketing numbers are finished. A research team funded by college’s own champions has now measured the inflation the skeptics alleged and printed it. What remains standing is a conditional claim: enrolling in a Texas public college added real earnings value for many students, before discounting, before taxes, before borrowing costs, on average, in one state, in one era.
That sentence is true and it is not a marketing sentence. It will not fit on a college-night slide. It fits on a spreadsheet, which is where a six-figure family decision belongs.
The authors got halfway to that spreadsheet, and the half they completed was the hard half. The half they skipped, the money math, requires no administrative data and no matching algorithm. It requires only the willingness to treat a family’s money with the same rigor everyone else’s capital gets. Their study plus that arithmetic equals the argument of my book: the question was never whether college pays on average. The question is when, for whom, at which school, and at what price.
The family asking those four questions is not cynical. It is doing what the best study in the field did, and then finishing the job.
For a Texas family, the finished job is already public. My model’s Texas summary page prices the state’s institutions at full cost, at typical net cost, and at zero cost. Every other state has a page of its own at collegeroi.org.
Companion Pieces
Reference Sources
- Deutsch, Jonah, Whitney Kozakowski, Naihobe Gonzalez, and Jessica Wagner. “Measuring the Economic Returns to Postsecondary Education at Scale: An Analytic Framework and Findings from Texas.” Mathematica and the Postsecondary Commission, May 2026. Accessed July 24, 2026. Headline figures in the Executive Summary and Exhibit ES.1. Funding and advisory board in the Acknowledgements.
- Deutsch et al., Section II.E and Technical Appendix Section B.4. Exact matching on age, prior degree, and high school county. Balance on test scores, low-income status, and prior earnings.
- Deutsch et al., Technical Appendix Exhibits D.8 and D.9. Matched versus unmatched 15-year bachelor’s value: $81,647 versus $108,763. Associate’s: $17,444 versus $30,846. Certificates: $6,079 versus $12,059. All 2008–09 entry cohorts.
- Deutsch et al., Technical Appendix Section A.3. Earnings summed in 2023 dollars, winsorized at the 99th percentile. No discount rate appears anywhere in the report’s methodology.
- Office of Management and Budget. Circular A-94, “Guidelines and Discount Rates for Benefit-Cost Analysis of Federal Programs.” The White House (archived), pre-2023 version. Accessed July 30, 2026. The base rate for the opportunity cost of private capital was 7 percent in real terms from 1992 until the 2023 revision.
- Author’s calculation from Deutsch et al., Exhibit 1, discounting each year’s increment at end of year. Values: $55,346 at 3 percent and $24,789 at 7.8 percent.
- Deutsch et al., Technical Appendix Section A.4. Net cost equals tuition plus fees plus books and supplies, minus waivers, exemptions, and grants. Housing and transportation excluded with stated rationale.
- Federal Student Aid, U.S. Department of Education. “Interest Rates for Federal Direct Loans First Disbursed Between July 1, 2026 and June 30, 2027.” Federal Student Aid, electronic announcement, 4 June 2026. Accessed July 24, 2026.
- Deutsch et al., Section II.F.2. Employer benefits such as health insurance and retirement contributions are not observed in unemployment insurance wage records, for either the enrolled group or the matched comparison group.
- Deutsch et al., Exhibit 1. Year 5 cumulative net value-added earnings: negative $33,925.
- Shivamber, Leon. We Need To Talk About Higher Education. 2026. Chapters 6 and 32 and the glossary: four years of forgone earnings at the median high school wage, about $148,000 in nominal pre-tax wages.
- Deutsch et al., Technical Appendix Section D. Liberal arts, social sciences, and parks and recreation programs carried negative 10-year cumulative net value, breaking even between years 10 and 15.
- Deutsch et al., Executive Summary. Cumulative net value at five years was negative in about one quarter of the 57 certificate-granting institutions.
- Deutsch et al., Exhibit D.6. Bottom-quartile high school math achievement, 2008–09 bachelor’s cohort, 10-year cumulative net value of negative $7,668.
- Deutsch et al., Exhibits D.12 through D.14. Completion-rate coefficients of roughly $2,000 per percentage point for bachelor’s cohorts, with smaller positive coefficients for associate’s degrees and certificates. Program-versus-institution variance in Exhibits D.15 through D.17.
- Deutsch et al., Exhibit B.5 and Appendix Section D.3. 28,614 matched students of 44,718 eligible, a 64.0 percent match rate, across 29 institutions.
- Deutsch et al., Section IV, citing Cellini and Turner (2019) on private and for-profit sector returns.
- Deutsch et al., Appendix Section E.2 and Exhibits E.3 through E.5. Terminal-year value moved +46, +40, and +32 percent under the looser earnings rule and −18, −49, and −26 percent under the stricter rule for bachelor’s, associate’s, and certificate cohorts respectively.