Georgetown’s Center on Education and the Workforce did something I wish more of this field did. It looked at one of the most quoted numbers in the college argument and said, out loud, that nobody has settled how to measure it.
The number is underemployment, the share of graduates working in jobs that never needed the degree. Depending on who is counting, it is 25 percent or it is 52. Those two numbers tell a family opposite stories about the same purchase, and the field has let both run loose.
The 52 comes from a 2024 Burning Glass and Strada report that found more than half of graduates underemployed a year after finishing, a number that has hardened into the story of a generation and powers the loudest version of the college-is-a-scam meme.[1]
At the other pole of the college argument sits the estimate by New York Fed economists Jaison Abel and Richard Deitz that a bachelor’s degree returned 12.5 percent a year for the median graduate in 2024, a number I have audited, which I often see quoted as proof that college is always worth it.[2]
Both numbers are doing the same bad job. A family deciding on one program at one school gets no answer from either one.
Rethinking Underemployment, by Jeff Strohl, Catherine Morris, Artem Gulish, and Matthew Martinez, walked into the middle of that fight.[3] It publishes the full range of estimates instead of picking the convenient end. It says it would be just as worried about a number that came in too low. And it declines to crown any single method, because the authors do not believe the measurement question is closed.
They are right. It is not closed.
When I spoke with the authors after their report came out, they said so plainly, and they were more interested in better questions than in defending any single number. A report like that, from Georgetown, is worth more than another confident number would have been.
They also did something harder than diagnosing the problem. They put an idea on the table.
The idea
The report’s own starting point is a federal classification: the Bureau of Labor Statistics assigns each occupation a typical education needed for entry. If a graduate works in an occupation coded high school level, she counts as underemployed. The report shows how clumsy that gets. Sixty-three percent of detectives and criminal investigators hold a bachelor’s degree or better, and the median detective with a bachelor’s degree earns $104,300 against $72,900 for colleagues with a high school diploma. Calling all of them underemployed is hard to believe, and the report says as much about the one in five workers in occupations coded high school level or below who hold a bachelor’s degree or better: “It is difficult to imagine all these workers are underemployed.”
So it proposes an adjustment. If a graduate in a high school level occupation earns at least 40 percent more than high school graduates in that same occupation, count her as using the degree. The 40 comes from the standard finding that each year of college returns about 10 percent. The classification alone puts underemployment among recent graduates in full-time, full-year work at 43 percent. Apply the adjustment and it falls to 25. It is one of two approaches the report puts forward.
The other, realized matches, compares a worker’s schooling to what is typical among the people already doing the job. My test here is of the first.
That is a real idea, offered by people who say plainly that the question is still open. The right response to a real idea is a test, not applause and not a takedown. Here is mine.
The test
Take a case built from the report’s own pages. A woman with a bachelor’s degree teaches group fitness classes for $42,200 a year. The typical fitness instructor with a high school diploma earns $30,000, so she clears the 40 percent bar by about two hundred dollars a year. The method counts her as using her degree.
Now look two tables over, where the report gives national median earnings for high school graduates by age. Between 25 and 34, $40,300. Between 35 and 44, $47,600. Between 45 and 54, $50,100. Her $42,200 is one median for all three age groups together, and it sits below the two older ones. On that same 25-to-54 basis, Table 1 puts the median high school graduate in high school level occupations at $45,000, and she earns less than that too.
The bar she cleared was set by high school graduates in her occupation, and they earn $30,000. Clearing a low number by 40 percent is a low bar. The question an actual 18-year-old is asking is simpler: “what would I earn without the degree.” The method answers “what would I earn as a fitness instructor without the degree.” Those are different comparisons, and the first one is the decision a family is actually making.
I want to be careful here, because this cut runs in both directions. Nobody measured what she would have earned without the degree. Not the report, and not me. The counterfactual is missing on both sides. My feedback stops short of saying the report picked the wrong number for her. The trouble is that the method quietly picks one at all, and the pick does the deciding.
What a premium can and cannot prove
The report anticipates this objection. In a footnote it leans on standard theory, that pay tracks productivity, and its main text draws the conclusion that a premium suggests the graduate brings college-level skills to the work.
Grant the premise and follow it. There are at least three ways she could be earning that premium:
- The degree taught her something the job uses.
- The degree got her past a hiring screen into a job that never needed it.
- She is good at this, and would have been good at it either way.
The method needs the first one. A snapshot of who earns what cannot tell the three apart, in their data or in mine.
There is a study that could, and as far as I can tell nobody has run it.
Take the large employers that hire constantly for jobs with no degree requirement. When a graduate applies, does the offer come in at a higher pay band than the offer to a high school graduate of the same age? If it does, the premium exists before the employer has seen a single day of work. If that early gap then shrinks once the employer sees her work, that is the screen story. If the gap only opens later, with performance, that is the productivity story. Pay-setting records could put direct evidence where the method now rests on an assumption, and it is exactly the kind of study a shop with Georgetown’s reach could run. I would read it the day it came out.
The row I would build on
Which brings me to my favorite number in the report, and it comes straight from the report’s own table.
Table 1 gives median earnings for graduates in two settings. In bachelor’s level occupations, $86,000. In high school level occupations, $62,000. The report uses the table to show that graduates out-earn high school workers wherever they land. Sitting in the same row is the comparison I would put on the next edition’s cover.
The gap is $24,000 a year. That is a 28 percent penalty at the median, 29 percent at the 25th percentile, and 23 percent at the 75th. Every point the report publishes tells the same story, so a few unlucky cases are not driving it. And it comes from the report’s own restricted sample, full-time, full-year workers ages 25 to 54.
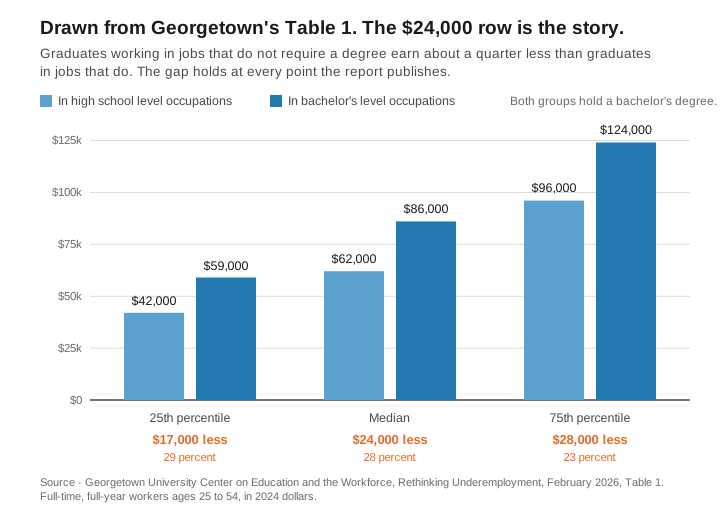
Here is why the $24,000 row matters more than the rate. The field can keep arguing about whether the underemployed are 25 percent of recent graduates or 52. This number says what landing in a high school level occupation costs a graduate at the median.
A snapshot cannot separate how much of this gap is the job from how much is the person who landed in it. The count has the same blind spot, and it says nothing about the cost. Pick any definition you like, and the penalty is still sitting in that table. A better measure would start from the cost, not the count.
Read down the column
Table 1 has a second lesson in it, and you can check it yourself against the full table below.
It has two halves, one for high school level occupations and one for bachelor’s level occupations. In each half there is a column for high school graduates and a column for college graduates, with three rows: the 25th percentile, the median, and the 75th. Read across a row and you get the premium for the degree. That is how the report reads it. In high school level occupations the premium comes to $10,000 at the 25th percentile, $17,000 at the median, and $33,000 at the 75th, once you subtract one column from the other.
| Earnings at | High school level occupations | Bachelor’s level occupations | ||||
|---|---|---|---|---|---|---|
| High school diploma | Bachelor’s degree | Premium | High school diploma | Bachelor’s degree | Premium | |
| 25th percentile | $32,000 | $42,000 | 31% | $43,000 | $59,000 | 37% |
| Median | $45,000 | $62,000 | 38% | $63,000 | $86,000 | 37% |
| 75th percentile | $63,000 | $96,000 | 52% | $91,000 | $124,000 | 36% |
Georgetown’s Table 1 in full. Earnings of full-time, full-year workers ages 25 to 54, in 2024 dollars. Source: Georgetown University Center on Education and the Workforce, Rethinking Underemployment, Table 1.
Now read down the college graduate column instead. The 25th percentile earns $42,000. The 75th earns $96,000. That is a $54,000 spread among people holding the same degree in occupations coded at the same level. Do the same in the bachelor’s level half and the spread is $65,000, against a premium that never passes $33,000 anywhere in the table.
The spread inside one credential is wider than the gap between the two, and it is not close.
One more comparison makes it concrete. A high school graduate at the 75th percentile in high school level occupations earns $63,000. The median college graduate in those same occupations earns $62,000. All of that is why medians hide the question a family is asking. The premium is a median laid over a spread wider than itself.
The fairest pushback to the penalty label is that the gap belongs to the occupation rather than the degree. The same table lets you test it. High school graduates show almost the same gap across the two halves, $45,000 against $63,000 at the median, about 29 percent. The gap follows the occupation, and it is not special to graduates. In this table, pay tracks the occupation for everyone who holds it, and the degree buys a chance at the better occupation, not a guarantee of it. For the graduate, the $24,000 row still shows the two branches of her bet.
The report’s Figure 2 shows the same thing one job at a time, and it is worth walking through the same way. The figure lists five high school level occupations where most workers hold a bachelor’s degree or higher, and for each one it gives median pay for a worker with a high school diploma and a worker with a bachelor’s. The table sorts the five by what the college graduate earns.
| Occupation | High school diploma | Bachelor’s degree | Premium |
|---|---|---|---|
| Exercise and group fitness trainers | $30,000 | $42,200 | 41% |
| Photographers | $35,400 | $42,900 | 21% |
| Media and communication workers | $57,900 | $71,900 | 24% |
| Advertising sales agents | $54,700 | $97,200 | 78% |
| Detectives and criminal investigators | $72,900 | $104,300 | 43% |
Median earnings of full-time, full-year workers ages 25 to 54, in 2024 dollars, for the five high school level occupations with the largest share of workers holding a bachelor’s degree or higher. Source: Georgetown University Center on Education and the Workforce, Rethinking Underemployment, Figure 2.
Read across, the way the report does, and every job shows a premium for the degree. Now read down the college graduate column. Fitness trainers, $42,200. Photographers, $42,900. Media workers, $71,900. Advertising sales agents, $97,200. Detectives, $104,300. Same degree in every row, and a spread of about $62,000 between the bottom and the top. Then cross the columns. The high school graduate who became a detective earns $72,900, more than the college graduate who became a fitness trainer, a photographer, or a media worker. Even the premium swings with the job, from 21 percent for photographers to 78 percent for advertising sales agents.
Whatever puts a graduate in one of those jobs, once she is there her pay tracks that job’s market, and the distance from the bottom of that list to the top is bigger than anything the degree adds inside one job. The diploma moves her within a job’s range. The range comes with the job.
The part a measure cannot see
One boundary, and it is not the report’s fault. Any study of graduates can only see people who finished. About 61 percent of students who start college finish a credential within six years, counting those who transfer and graduate somewhere else.[4] Run the report’s most generous number for recent graduates through that filter. Of every 100 who enroll, about 61 finish, and the report’s earnings approach counts about 75 percent of finishers in college-level work, so about 46 both finish and reach college-level work. Some who never finish land college-level work too, and this arithmetic does not count them. Run the BLS-based number instead and it is about 35.
Those two rates come from different groups of people. The completion figure counts everyone who starts anywhere and any credential they finish, certificates and associate degrees included. The employment figure counts only bachelor’s degree holders ages 22 to 23 who work full time, year-round. The Department of Education’s six-year rate for four-year colleges, which leaves out part-timers and counts only students who finish at the college where they started, runs at 64 percent for students who started in 2014.[5] Sixty-one is the lower of the two. At 64, about 48 of every 100 both finish and reach college-level work.
The family’s question crosses that boundary even though the report’s data cannot. Nobody at 18 gets to start at graduation. She has to get there first, and six years in, about four in ten have not. Whatever the field settles on, the measure a family needs has to start at enrollment, where the risk actually begins.
My feedback, then
The report leaves the field with a question: what should this measure be?
Here is my answer, and a distinction first. Part of what I have argued is about making the underemployment measure better: the comparison group, the coding, the sample. The rest is about what no underemployment measure can do. Cost, completion, and the price of the specific program are not refinements of this metric. They sit outside it, and they are most of what a family actually needs to know. A perfect underemployment rate would still not tell an 18-year-old whether this program at this price is worth four years.
Keep the range honest, the way this report did. Settle the definition, so a family is not left toggling between 25 and 52 depending on who is talking. Publish distributions alongside the medians, because the middle of the class was never the question, the bottom of the class was. And build toward failure rates a family can look up before anyone signs, program by program, school by school, starting from enrollment.
Putting an idea out in public where the field can argue with it is how measurement gets better. The report did that, and this piece is my part of the argument. The fitness instructor earned her $42,200 herself, whatever the method calls her. What the four years cost her, and what they returned, is the question no measure of job titles was built to answer.
Somebody has to. I do it one program at a time, at Explore College ROI.
Companion Pieces
- The Study That Got Halfway There
- The Doubt Everyone Explained Away
- Your Major Isn’t Versatile. You Are.
Reference Sources
- Burning Glass Institute and Strada Institute for the Future of Work. “Talent Disrupted: College Graduates, Underemployment, and the Way Forward.” The Burning Glass Institute, February 2024. Full report (PDF). Accessed August 10, 2026. The report finds that “52 percent of graduates are underemployed a year after graduation” and 45 percent a decade later, where underemployment means working in an occupation in which fewer than half of workers either hold, or are required to hold, a bachelor’s degree.
- Abel, Jaison R., and Richard Deitz. “Is College Still Worth It?” Liberty Street Economics, Federal Reserve Bank of New York, 16 April 2025. Accessed August 10, 2026. The rate of return on a bachelor’s degree for the median graduate was 12.5 percent in 2024, comfortably above common investment benchmarks, with the companion finding that college might not be worth it for at least a quarter of graduates.
- Strohl, Jeff, Catherine Morris, Artem Gulish, and Matthew Martinez. “Rethinking Underemployment: Are College Graduates Using Their Degrees?” Georgetown University Center on Education and the Workforce, 18 February 2026. Full report (PDF). Accessed July 25, 2026. Source of the earnings-premium method and its 40 percent threshold, the earnings by occupation type and percentile in Table 1, the high school earnings by age in Table 2, the five-occupation earnings comparison in Figure 2, including the detectives figures, and the underemployment rates cited.
- National Student Clearinghouse Research Center. “Yearly Progress and Completion.” National Student Clearinghouse Research Center, 4 December 2025, fall 2019 cohort. Accessed July 25, 2026. About 61 percent of students who start finish a credential within six years, counting those who transfer and graduate elsewhere.
- National Center for Education Statistics. “Undergraduate Retention and Graduation Rates.” NCES, Condition of Education. Last updated May 2022. Accessed July 25, 2026. The six-year graduation rate for first-time, full-time bachelor’s-seeking students at four-year institutions is 64 percent for the fall 2014 entering cohort, counting only students who finish at the institution where they started and excluding part-time students.