The most famous finding in the college-prestige debate is more than a quarter century old and, on the question it asked, still undefeated. Economists Stacy Dale and Alan Krueger tracked thousands of students who applied to the same caliber of schools, some of whom attended the more selective college and some of whom went elsewhere. Their conclusion, in their own words: “Students who attended more selective colleges do not earn more than other students who were accepted and rejected by comparable schools but attended less selective colleges.”[1]
I recently went back and read both of their papers carefully: the original study, circulated in 1999 and published in 2002, and the follow-up, circulated in 2011 and published in 2014, which re-ran the analysis on Social Security earnings records. I did it because I cite this work, and I wanted to be certain it says what I claim it says. It does.
What I did not expect to find is that the study everyone cites to settle the prestige debate undersells its own conclusion. On the money side, Dale and Krueger measured earnings, and only earnings. They never subtracted what prestige costs from the earnings they tested. Add that side of the ledger and their conclusion gets stronger.
Start with what they actually did, because the design is the reason the finding has survived nearly three decades of pushback. Comparing Harvard graduates to state-school graduates tells you little about what Harvard adds, since Harvard picks its students. Dale and Krueger’s answer was to compare students who revealed their own ability through their applications: comparable test scores, applying to the same caliber of schools, in some versions accepted and rejected by the same schools.
And selectivity, in their papers, is not a vibe. They measured it three ways: the school’s average SAT score, its rating in the Barron’s guide of college competitiveness, and its average tuition after aid. On the first two, where those students enrolled made no measurable difference to what they earned. The third, price, took longer to settle, and its story is coming.
My favorite detail in the 2002 paper: the selectivity of the most selective school that rejected a student predicted that student’s later earnings better than the selectivity of the school the student attended.[1] The talent was in the applicant, not the acceptance letter.
Now the part that matters for a family staring at two prices. Read the papers’ fine print and three absences stand out.
They measured pre-tax earnings. In 2002 that meant self-reported annual earnings, and in 2014 it meant earnings reported to the IRS.[2] No tax adjustment anywhere.
They never subtracted what the student paid from the earnings they tested. None of their earnings regressions takes out tuition, fees, or the four years of wages a student gives up while enrolled. In those regressions, cost appears only as a school characteristic, never as a deduction from the outcome.
They never discounted the earnings they tested. Neither paper puts a present value on the selectivity results, what those future dollars are worth on the day a family pays the bill. The closest they come is translating their tuition estimates into rates of return.
None of that is a flaw. It is a boundary. Dale and Krueger set out to answer one main question, whether the selective school raises the earnings of comparable students, and they answered it: for most students, no.
But notice what that boundary means. Their null result, the economists’ term for finding no effect, says prestige does not add earnings for the typical student. It says nothing about the fact that prestige usually adds cost. A wash on the earnings side plus a real difference on the cost side does not stay a wash. It adds up to a verdict.
Their own work brushed against the cost question and then, to their credit, went back and checked it. The 2002 paper found one school trait that did seem to pay even after their careful matching: tuition after aid, what the papers call net tuition. Students who attended more expensive schools appeared to earn more, an implied return of thirteen to fifteen percent.[2]
Twelve years later they re-ran the analysis with a better yardstick, actual earnings reported to the IRS over twenty-five years instead of a single year of self-reported survey income. The tuition effect for the full sample fell to essentially zero, too small to tell from nothing.[2] Price, it turns out, does not detectably buy earnings either, and they were candid that the estimates were imprecise. The better their data got, the less anything about the school itself seemed to matter.
My model points the same way from the other direction, on today’s data. Across the 1,679 bachelor’s-granting colleges in my model, the price of the school explains six to thirteen percent of the differences in what its graduates earn.[3] About fifteen percent of the cheapest quarter of colleges out-earn the median of the most expensive quarter. Expensive schools are not reliably high-outcome schools, and cheap schools are not reliably low-outcome ones. This is visible on one chart for any field you care about at collegeroi.org: cost runs along the bottom, earnings run up the side, and the dots climb only gently to the right.
One scope note before I join the halves. Dale and Krueger’s matched students all enrolled inside a selective band, the 30 colleges and universities in their original sample,[1] so their null is about which selective school to attend, not about college versus no college. The price arithmetic below is mine, from a model that scores all 1,679 institutions, and it stands on its own math.
So put the two halves together. Dale and Krueger showed that for most comparable students, the selective school does not add earnings. The data shows the selective school usually adds price. Run the full investment arithmetic, earnings minus cost minus taxes minus the four unpaid years, discounted like any other bet that pays out over a working life, and the conclusion lands harder than either half alone.
In the federal data I use, 83 bachelor’s-granting colleges admit fewer than one in four applicants. In my model, 40 of the 81 that report enough to score leave their own median graduate behind the high school path, at full sticker price.[4]
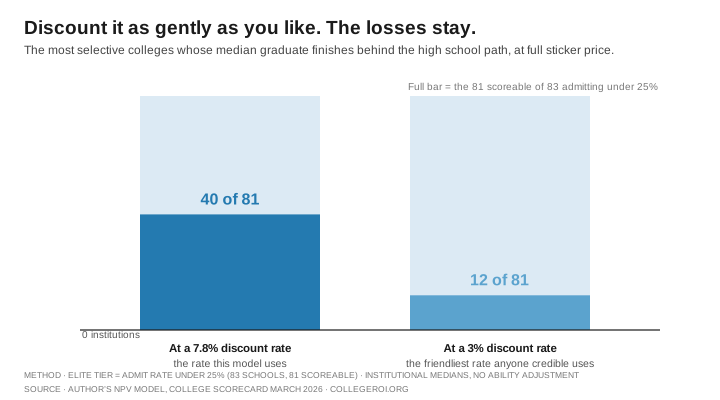
And the losses do not vanish when I discount more gently. Drop the rate to 3 percent, far friendlier to college than the rate I use, and 12 of those 81 are still behind. The count moves with the rate. The direction does not.
That is a tougher bar for my argument than the question requires. Ask only whether the premium over a cheaper acceptance is worth paying, and a school that cannot beat going straight to work has already answered.
One caution in reading those counts: my model compares whole institutions, not matched students, so the raw results still contain everything Dale and Krueger warned about, namely who enrolls where. The direction of that bias is clear. Better students make a school look better, so the raw results flatter the schools rather than the reverse.
One thing does cut the other way: my earnings figures come from graduates four years out, and the most selective schools send many graduates on to graduate and professional school, where year four pays little.[2] Their full careers look better than my snapshot. Dale and Krueger measured those later years too, and once they adjusted for the colleges each student applied to, the payoff to the more selective school stayed too small to tell from zero in every period, early career or late.[2] The family signing the check controls the price, not the timing.
And the version of the argument that needs no model at all still stands inside Dale and Krueger’s own data: matched students, earnings too close to tell apart, different prices. For most of them, the cheaper seat comes out ahead on net before I compute anything.
Most offers land somewhere between free and sticker, which is why none of this ends in one rule for every price. At the prices students actually pay after aid, the most selective tier does come out well ahead of the high school path in my model.
Look at what moves that result: the aid itself. At full sticker, the median school in that tier, with the same graduate earnings, only breaks even. The price cut made the difference. Your own award letter, run against the cheaper path, is the number that decides.
What about the famous exception? Dale and Krueger found that the selectivity payoff, near zero for most students, stayed meaningfully positive for two groups: Black and Hispanic students, and students whose parents had less education.[2] The exception is real, and it survives the adjustment for where each student applied. Why it exists is a different question, and here the honest answer is that I have not seen anyone settle it. In the follow-up paper, Dale and Krueger offer a conjecture: the networks a selective campus supplies to students who arrive without them. My own reading follows the money. Whatever caused the earnings gain for students who entered in 1976 and 1989, the price side looks different today: many of the most selective schools now advertise meeting full financial need,[5] so a talented student from a family with little money can attend nearly free, and as this whole argument shows, free changes any return.
The two readings lead to the same advice. If a selective school offers a talented student a nearly free seat, take it. That is not a purchase of prestige. It is a gift of price.
Which leaves the version of the advice the study everyone cites does not support: paying full sticker at the more selective school because the name will pay you back. For most students, the earnings evidence says it does not.
The strongest modern challenge finds something real in the tails, the rare extreme outcomes. For applicants on the edge of getting in, the economists Raj Chetty, David Deming, and John Friedman found that attending an Ivy-Plus college (the Ivy League plus Stanford, MIT, Duke, and Chicago) instead of the average public flagship raises the chance of reaching the top one percent of earners by half, nearly doubles the chance of ending up at an elite graduate school, and makes a job at a prestigious firm about two and a half times as likely.[6] Those effects are real and carefully measured.
The question they answer, though, is what admission changes, not what the seat costs. The tail is a lottery ticket with better odds at the elite school. The question of this piece is still the ticket’s price. The price evidence says the premium you are paying does not detectably buy earnings for the typical student. And the investment arithmetic says the full-sticker seat often lands behind the path that costs nothing at all.
The most famous study in the prestige debate, read all the way through and priced all the way out, is the strongest case against paying for prestige I know of. Run your own numbers before you sign anything. The tools are free, and unlike the acceptance letter, the math is not trying to fill a class.
Companion Pieces
Reference Sources
- Dale, Stacy Berg, and Alan B. Krueger. “Estimating the Payoff to Attending a More Selective College: An Application of Selection on Observables and Unobservables.” Quarterly Journal of Economics 117, no. 4 (2002): 1491–1527. Circulated as NBER Working Paper 7322 (1999). The working paper’s estimates differ from the published tables. Conclusion quoted verbatim (p. 1523). The rejected-schools result: a 100-point increase in the highest average SAT among schools that rejected a student is associated with 7 percent higher earnings (Table IV, p. 1510). Outcome variable: pre-tax 1995 annual earnings (footnote 8). Sample: College and Beyond 1976 entering cohort at 30 selective colleges and universities.
- Dale, Stacy, and Alan B. Krueger. “Estimating the Effects of College Characteristics over the Career Using Administrative Earnings Data.” Journal of Human Resources 49, no. 2 (2014): 323–358. Circulated as NBER Working Paper 17159 (2011), under the title “Estimating the Return to College Selectivity over the Career Using Administrative Earnings Data.” Earnings from SSA administrative records (IRS-reported, pre-tax). Selectivity returns “indistinguishable from zero” in selection-adjusted models for the full sample. Exceptions for Black and Hispanic students and students from less-educated families remain large in adjusted models (abstract, Tables 7–8). Net-tuition effect for the full sample approximately 0 to 0.02 and insignificant in the self-revelation model, which the authors say makes the 2002 estimate appear “atypically high”. Subgroup precision caveats: the race result is most robust in the 1989 cohort, and standard errors are large. The 2002 net-tuition finding (implied internal rates of return of 13 to 15 percent) is at QJE Table VIII, pp. 1520–1521. The networking conjecture is at Working Paper 17159, pp. 24–25.
- Author’s model, 1,679 bachelor’s-granting institutions, College Scorecard March 2026 release. Correlations computed on the 1,678 carrying both cost fields: sticker cost against median graduate earnings four years after graduation r = 0.36 (R² = 13.0 percent). Net price r = 0.25 (R² = 6.4 percent). Ranked by sticker cost among the same 1,678, 15.3 percent of bottom-quartile institutions exceed the top quartile’s median earnings.
- Author’s model. Eighty-three bachelor’s-granting institutions admit fewer than 25 percent of applicants, and 81 report enough cost and earnings data to score. At the model’s 7.8 percent discount rate, 40 of those 81 leave their median graduate behind the high school path at full sticker price, and 16 of the 81 do so at each school’s average net price. Rerun at a 3 percent discount rate and 12 of the 81 are still behind at full sticker, 6 at net. The count is rate-sensitive, the direction is not. Institution-level medians with no student-ability adjustment. Per Dale and Krueger, raw tier gaps overstate school contributions, so these shares describe the price a family pays rather than any causal effect of the school. Admission rate is used here as a grouping device for an argument about selectivity, never as a proxy for quality. Run any school at https://collegeroi.org.
- Three examples, each from the school’s own financial-aid page, accessed September 24, 2026. Duke (financialaid.duke.edu): “Duke meets 100% of demonstrated need for undergrads”. MIT (sfs.mit.edu): “We meet 100% of an undergraduate’s demonstrated need through our types of aid.” The same page, for families with income under $100,000: “Families with income below this level (and typical assets) have a $0 parent contribution.” Penn (srfs.upenn.edu/financial-aid): “Penn’s grant-based undergraduate financial aid program meets 100% of demonstrated financial need with grants and work-study funding”.
- Chetty, Raj, David J. Deming, and John N. Friedman. “Diversifying Society’s Leaders? The Determinants and Causal Effects of Admission to Highly Selective Private Colleges.” Quarterly Journal of Economics 141, no. 1 (2026): 51–145. Circulated as NBER Working Paper 31492 (2023, revised August 2025). Accessed July 6, 2026. Findings paraphrased from the introduction’s estimates for the marginal admit relative to the average flagship public college (about 50 percent, nearly twice, and 2.5 times, August 2025 version, p. 3).