In December 2025 the Department of Education added one line to the FAFSA, the form families fill out to apply for federal student aid. After a student submits the form, if a school on the list has graduates who typically earn less than a high school graduate in that state, or nationally for some schools, a notice appears on the summary page. Click it and you see the earnings number for every school on your list, and a button to change the list. That is all. The aid is the same. The school is the same. Nothing is blocked.[1]
In March 2026 the Department reported what happened next. About a quarter of the students who saw that notice removed the school and put another one in its place.[2]
Sit with that for a moment, because the notice is about as gentle as a warning gets. It counts only the students who finished. It compares them to what a high school graduate earns, and nothing else. It ignores what the degree cost. It arrives after the list is set, and only for the students who filed for aid. It touches a slice of schools most families do not consider. A quarter moved anyway.
I have spent two years arguing that families would use honest information about what a college returns, if anyone put it in front of them at the moment they decide. That argument has been a theory. This is the first time the federal government has put that test inside the aid application itself and reported what students did, and the test was tilted toward no. Here is what the flag is, how low its bar sits, whom it reached, what it did, and what an honest version would look like.
One sentence on a summary page
The indicator went live on December 7, 2025. It applies only to first-year undergraduates. It appears only after the FAFSA has been processed, on the FAFSA Submission Summary, and only for students who listed at least one flagged school.[1]
The Department is careful about what the sentence is not. It is “informational only.” It changes nothing about eligibility or aid. The Department “takes no position on the underlying value” of any school. And the earnings are “provided at the institutional level,” so “post-graduation earnings will vary by degree and program type, which are not reflected in the data presented.”[1][3]
What the sentence compares is simple. On one side, the median earnings of a school’s graduates four years after they finished. On the other, the median earnings of high school graduates aged 25 to 34 in the same state, or nationally for schools that operate in more than one state or draw most of their first-year students from out of state. If the graduates earn less, the school is flagged.[3]
That is the minimum viable warning, and its mildness is what makes the result worth reading. The government blocked nothing. It showed a number and a button.
The lowest bar that could be built
The bar has four soft spots, and each one is a subject I have written about before.
It counts graduates only. The earnings belong to students who completed. The student who borrows, leaves in the second year, and goes on to earn what a high school graduate earns is not in the number. My rule in the book is to name the basis every time, because the two bases give different answers. Measure the return to graduating, and 79 percent of four-year colleges leave the median graduate behind the high school path at full cost. Measure the return to enrolling, which prices in the students who never finish, and about 85 percent leave the typical enrolling student behind. At the price families pay after aid, the two shares are 57 and 65 percent. Same schools. Different question.[4]
The Scorecard itself switched its headline earnings number to this graduates-only measure in March 2026. In the book I ran the comparison across 4,816 institutions: 92 percent showed higher earnings under the new number, by a median of 21 percent, and not one graduate earned a dollar more because of the switch. The flag has used that measure from its first day.[4]
It counts aid recipients only. The graduates in the number are the ones who received federal aid. Those are the students whose records the Department links to tax data.[3]
The bar is the floor. A school clears it when its graduates out-earn the median high school graduate aged 25 to 34, in gross pay. Both sides count only people with some earnings. Nothing is charged for what the degree cost, what was borrowed, or the years not worked. That is an earnings test. It is not a return. A return asks whether you got back more than you put in, and a school can pass this test while leaving its graduates worse off than if they had gone to work.[3]
It averages the whole school. A weak program inside a strong college is invisible, and so is a strong program inside a weak one. The Department says this itself, in the announcement that launched the flag.[1]
One piece of the measure leans the other way. Four years out is early, and graduates of four-year colleges are still climbing, so the window is harder on them than a longer one would be. Nearly all four-year colleges clear it anyway.
So the flag is a soft reading of a soft measure. A school that fails it has failed a test that more than four in five schools pass.
Whom it reached
When the flag launched in December, it marked 1,365 institutions, 23 percent of the schools in the Department’s database.[5] After the Department refreshed the data in March, the number fell to 999 of 5,826, about 17 percent.[6]
The schools did not change between December and March. The data did. The Department swapped in a later class of graduates, whose earnings were measured in 2022 and 2023, for an earlier class measured in 2019 and 2020. Of the 1,365 schools flagged in December, 885 stayed on the list, 434 walked off it, and 46 dropped out of the file. Another 114 joined. At the schools that walked off and have figures in both files, the graduates’ earnings figure rose a median 16 percent while the high school benchmark slipped 2 percent. A bar set at the floor is also a bar that moves with the tide.[6]
Who are they? Michelle Dimino of Third Way looked at the December list and said “well over half” were beauty schools and cosmetology institutes. Inside Higher Ed wrote that “most of the 1,365 institutions flagged for lower earnings are for-profits and beauty schools,” with a few community colleges and historically Black colleges on the list.[5] Of the 999, I could match 962 to the college data I use for my own work. Of those, 918 mainly award certificates. Fourteen mainly award associate degrees. Thirty mainly award bachelor’s degrees, and those thirty are fourteen rabbinical colleges and yeshivas, four small Christian colleges, three music schools, two art schools, and seven other colleges with a few dozen to a few hundred students each. Of the 37 I could not match, all but one are beauty, barber, massage, and drama schools. The other is an allied-health school.[6]
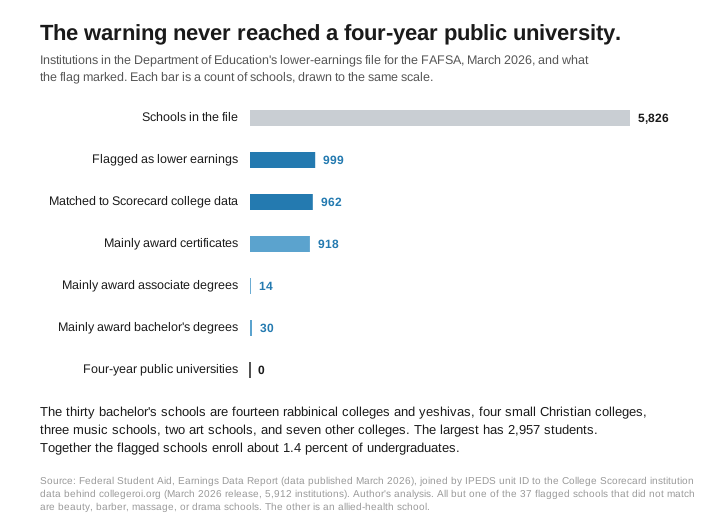
Not one four-year public university was flagged, and the largest school on the list that mainly awards bachelor’s degrees has fewer than 3,000 students. Every four-year public university with published earnings clears a bar this low. My own numbers say most four-year colleges would not clear an honest one.[4]
The students the flag reached are a thin slice as well. The Department said at launch that “more than 2 percent of undergraduate students nationwide attend an institution where graduates earn less than a high school completer on average,” and that those schools take in “upwards of $2 billion in Federal student aid annually.”[7] My count from the March file puts the flagged schools at about 1.4 percent of undergraduate enrollment.[6] Either way, the flag never met the family choosing between a state flagship and a private college at three times the price. It met the student headed to a certificate program.
And it met that student late. Only FAFSA filers see it. Only after they submit. The student who decided in April and never filed, or filed and did not read the summary, never saw a thing.
A quarter moved
Here is the Department’s sentence, in full: “Since launching the indicator in December 2025, approximately 25 percent of students who were presented with the low earnings flag removed the school and updated their form with another school.”[2] Moved, here, means exactly that. They changed the list. Where they enrolled, the Department has not said.
Now what it does not say. It does not say how many students saw the flag. It does not say whether the school they switched to clears the bar. It does not say how many would have changed their list anyway, because it reports no comparison group. Students edit their school lists for all sorts of reasons, and the Department has not said how often they do it when no flag appears. Until it does, the quarter is a share, not a measured effect.
The sponsored piece in The Hill that carried the number into the policy debate wrote that students “replaced it with a higher-earning alternative.”[8] The Department did not write that. I am quoting the Department.
So the number is soft. And it still counts, for a reason that has nothing to do with its precision. A sentence that changed nothing about the money, shown after the list was set, with the Department itself insisting it took no position, moved a quarter of the people it was shown to. Think of the tire-pressure light that comes on after you have left the driveway. If a quarter of drivers pulled over for a light that dim, that late, you would call the light effective.
The critics have a fair point, and it is worth stating plainly. Jon Fansmith of the American Council on Education called the flag “a blunt tool for a nuanced process that has enormous potential for creating misleading outcomes.”[5] He is right that it is blunt. A whole-school average against a state median for high school graduates is about as blunt as a measure gets. But the blunt tool moved a quarter. The answer to a blunt tool that gets a response is a sharper one, not a softer one.
The question I have been asked most often about my own work is whether families would use outcome information if they had it, or whether they choose on brand and feeling and the numbers never enter. The government’s own data now gives a first, rough answer. Some of them use it. Even when it is weak. Even when it comes late.
What follows
If the softest signal moves a quarter, the leverage is in the signal, not the audience. One caution belongs here. The students the flag reached had little riding on the school they dropped. The families hardest to move are the ones most attached to a name, and nothing like it has been tested on them. That is the experiment worth running.
Four changes would turn the flag into an honest one, and each one is the mirror of a soft spot above.
Count everyone who enrolls, not only the ones who finish. The student who leaves with debt and no degree is the one the warning exists for.
Measure the return, not the pay. Put the cost and the years of forgone work on one side and the earnings on the other, and ask whether the graduate came out ahead of the high school path. That is the question a family is actually asking.
Show it by program. A nursing program and a music program in the same building are not the same bet, and the Department already collects program-level earnings.[7]
Show it before the list is set. The summary page is the wrong place. The right place is the kitchen table in the fall of senior year, and the counselor’s office, and the college-search site, before the application list hardens.
Two routes lead there and they are not the same route. The first is legislation. The College Transparency Act, from Senators Bill Cassidy and Elizabeth Warren, with Representatives Mike Kelly and Raja Krishnamoorthi, would require the government to publish completion, earnings, cost, and debt data college by college and major by major. The Senate committee advanced it in July 2026 by a vote of 21 to 1.[9] Note who carried the earnings-flag number into the argument for the bill: Third Way on the center-left and the American Enterprise Institute on the center-right, in one sponsored piece.[8] The flag is a Trump-administration measure. The bill is a Cassidy-and-Warren measure. The idea underneath belongs to no party.
The second route needs no bill. A family can run the math today. The data the flag uses is public, the cost of any school is public, and the arithmetic fits on one page. I built a tool at collegeroi.org that runs the return for nearly any college in the country, cost included, and the book runs the enrolling basis beside it.
The habit is the same either way. Open your options. Run your numbers. The Department’s flag ran the numbers for a thin slice of students, late, on soft terms. The habit does it for any family, early, on honest terms. You can have your dream. Don’t overpay for it.
One line on a summary page, built to offend no one, moved a quarter of the people it was shown to. Imagine what an honest one would do.
Companion Pieces
- Compared to What?
- College Is a Bet, and No One Shows You Your Odds
- Auditing the Numbers That Say College Pays
Reference Sources
- Federal Student Aid. “New Lower Earnings Indicator on the FAFSA® form (Updated March 23, 2026).” FSA Partner Connect, Electronic Announcement GENERAL-25-49, 8 Dec. 2025, updated 23 Mar. 2026. Accessed September 28, 2026. Effective December 7, 2025. “This lower earnings indicator applies only to first-year undergraduate students.” Shown “after submitting the FAFSA form” on the FAFSA Submission Summary. “This disclosure is informational only.” “The data presented here is provided at the institutional level. Post-graduation earnings will vary by degree and program type, which are not reflected in the data presented.”
- U.S. Department of Education. “U.S. Department of Education Celebrates More Than 10 Million FAFSA® Forms Complete and Additional Transparency Measures.” Press release, 26 Mar. 2026. Accessed September 28, 2026. “Since launching the indicator in December 2025, approximately 25 percent of students who were presented with the low earnings flag removed the school and updated their form with another school.” The release gives no count of students shown the flag, no comparison group, and no information on the replacement schools.
- Federal Student Aid. “Lower Earnings Data.” FSA Data Center. Accessed September 28, 2026. Graduates’ earnings are the College Scorecard’s “median earnings of undergraduate completers during 2017–18 and 2018–19 who received Title IV aid, were earning income, and were not enrolled in an IHE four years after graduation,” adjusted to January 2026 dollars. The benchmark is the American Community Survey 2023 five-year “state and national median earnings of high school graduates with positive (non-zero) earnings, between the ages of 25 and 34 (inclusive).” “All institutions of higher education (IHEs) in the College Scorecard are included” except those in the territories, those with no published earnings for the pooled cohort, and those conferring only graduate credentials. “The U.S. Department of Education takes no position on the underlying value of educational services provided by any institution.” The link to tax data is described in the College Scorecard’s Institution Data Documentation: “data on federally aided students have been linked to earnings data from administrative tax records maintained by the Department of the Treasury.”
- The graduating and enrolling bases are from the model behind my book: 79 percent of 1,679 bachelor’s institutions fall short of the high school path at full cost on the return to graduating, and 84.8 percent of 1,656 on the return to enrolling, which weights each school’s outcome by its eight-year completion rate, and 57 and 65 percent of the same 1,656 at the price families pay after aid. The method is set out in the companion essay Compared to What? on collegeroi.org, accessed September 28, 2026. The display-shift figures are from chapter 31 of my book, We Need To Talk About Higher Education (2026), and its Table 31-A: across 4,816 institutions reporting both metrics, 91.8 percent show higher earnings on the Scorecard’s measure of completers four years after graduation than on its measure of the entry cohort eleven years after enrollment, a median rise of 21.4 percent, or $8,467. Certificate programs rose 25 percent on average. The December 2025 FSA file’s definitions sheet names the four-years-after-graduation measure as the flag’s source from launch. The Scorecard’s data changelog records the switch on March 23, 2026: “The Median Earnings metric was updated to measure earnings for students who received federal aid 4 years after graduation.”
- Knott, Katherine. “Education Dept. Labels Hundreds of Colleges as ‘Lower Earnings.’” Inside Higher Ed, 9 Dec. 2025. Accessed September 28, 2026. “About 23 percent of the nearly 5,900 institutions in the department’s database will be labeled as ‘lower earnings.’ Those colleges enroll fewer than 3 percent of undergraduates and receive about $2 billion in federal student aid annually.” “Most of the 1,365 institutions flagged for lower earnings are for-profits and beauty schools. A few on the list are community colleges and historically Black colleges and universities.” Michelle Dimino of Third Way: “well over half” were beauty schools and cosmetology institutes. Jon Fansmith of the American Council on Education: “This is a blunt tool for a nuanced process that has enormous potential for creating misleading outcomes.”
- Federal Student Aid. “Earnings Data Report,” data published March 2026, downloaded September 28, 2026 from the FSA Data Center. Of 5,826 institutions listed, 999 are marked “Yes” in the column that flags a school as lower earnings on the FAFSA Submission Summary, 789 against a state threshold and 210 against the national one. My sector split joins the file’s IPEDS unit IDs to the College Scorecard institution data behind collegeroi.org (5,912 institutions, March 2026 release): 962 of the 999 match, of which 918 predominantly award certificates, 14 associate degrees, and 30 bachelor’s degrees. Of the 37 that do not match, 36 are, by name, cosmetology, barber, massage, and drama schools. The other, Allied Health Careers Institute in Murfreesboro, Tennessee, trained medical assistants, coders, and phlebotomists (archived homepage, May 28, 2024). The 30 include 14 rabbinical colleges and yeshivas, the Manhattan School of Music, the Curtis Institute of Music, the Los Angeles College of Music, and colleges such as Beacon, Landmark, and College of the Atlantic. The flagged schools’ undergraduate enrollment in that data is 199,847 of 14,394,150, or 1.4 percent. The December comparison uses the December 2025 file as captured by the Internet Archive on December 17, 2025 (fafsa-earnings-data.xlsx): 5,899 institutions, 1,365 flagged, completers of 2014–15 and 2015–16 measured in 2019 and 2020 in June 2025 dollars, against the 2019 and 2020 five-year ACS. Of the 1,365, 885 remain flagged in March, 434 are listed and unflagged, 46 are no longer listed, and 114 institutions are newly flagged. For the 378 unflagged schools with earnings values in both files, the median change in the inflation-adjusted earnings figure is +16.3 percent and in the benchmark −2.4 percent.
- U.S. Department of Education. “U.S. Department of Education Launches New Earnings Indicator to Support Students and Families in Making Informed College Decisions.” Press release, 8 Dec. 2025. Accessed September 28, 2026. “More than 2 percent of undergraduate students nationwide attend an institution where graduates earn less than a high school completer on average. These same institutions receive upwards of $2 billion in Federal student aid annually.” On program data: “Students can further explore program-level results using the College Scorecard.”
- Cecil, Ben, and Preston Cooper. “College Students Deserve Better Data.” The Hill, sponsored content from Third Way, 14 Sept. 2026. Accessed September 28, 2026 (PDF). “Nearly one in four students who saw a warning removed the flagged institution from their aid application and replaced it with a higher-earning alternative.” The Department’s own release, note 2, says only that students “updated their form with another school.” Cecil is deputy director of higher education policy at Third Way. Cooper is a senior fellow at the American Enterprise Institute. Inside Higher Ed (note 5) calls Third Way “a left-of-center think tank.” Wikipedia calls AEI “a center-right think tank” (accessed September 28, 2026).
- Office of Senator Elizabeth Warren. “Warren Statement on Her Bipartisan College Transparency Act Advancing Out of Senate Committee.” Press release, 30 July 2026. Accessed September 28, 2026. “The Senate Health, Education, Labor, and Pensions (HELP) Committee’s bipartisan 21-1 vote to advance Senators Elizabeth Warren (D-Mass.) and Bill Cassidy’s (R-La.) College Transparency Act out of committee.” House companions are led by Representatives Raja Krishnamoorthi and Mike Kelly.