When a concert sells out in four minutes, you learn one thing. More people wanted tickets than the hall had seats. You’d assume the band is good, and maybe it is. But a small hall fills fast, and the sellout alone won’t tell you how good the band is.
A college’s acceptance rate works the same way. It tells you how many students applied for each offer the school made. In my experience, families still read a low rate as a sign of a better school, and every fall they build their lists around it.
So try this. Say your child is holding two letters for the same major. The students at both schools have about the same SAT scores, and after aid, both cost your family about the same. One school admits fewer than one in four applicants. The other admits six in ten or more.
How much more a year do you think the harder door pays, four years after graduation? Keep your guess in mind.
I wanted to know too. So I checked it against my College ROI model, which covers more than 30,000 of the bachelor’s programs the federal government reports earnings for.
Four things shape what a degree pays you back. What you study matters most. Who you are when you arrive and what you pay come next. How hard the school was to get into comes a distant last. I’ll take them one at a time, and your guess comes up in the third section.
What you study matters most
The biggest choice is the one a school ranking mostly misses.
At a typical college, the programs near the top pay their graduates about $81,800 a year four years out. The programs near the bottom pay about $45,800.[1] Same campus, same dorms, same name on the diploma. The gap follows the field.
Picture all the differences in pay across the bachelor’s programs in my model as a pie. The major accounts for about half of it. The school accounts for a little more than a quarter.[1] So knowing the major tells you about twice as much about what a program pays as knowing the school. A ranking scores the whole school, so it mostly misses the bigger slice.
Sorting schools by price doesn’t change that. Engineering graduates earn about $47,000 to $54,000 a year more than music graduates, at the cheapest quarter of schools and the most expensive.[1]
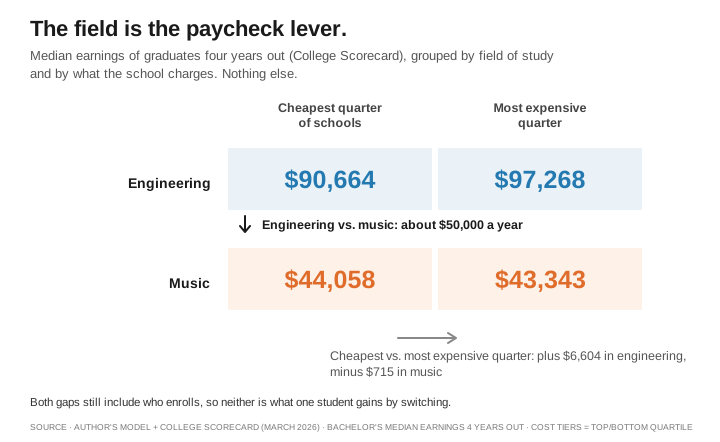
Some of that gap is who chooses each field, just as a school’s pay reflects who it enrolls. But the most careful test I know of finds much of it is the field itself.
In Norway, one central system handles admissions to almost all colleges. Two applicants can land a hair apart at a field’s cutoff. One gets in, and the other goes to their next choice. They’re about the same student on different paths. Lars Kirkebøen, Edwin Leuven, and Magne Mogstad compared students like these. They found “different fields have widely different payoffs, even after accounting for institutional differences and quality of peer groups.”[2]
So choose the field first. One caution: in fields like chemistry and biology, many graduates go on to graduate school, so pay four years out understates what they go on to earn.
Scores tell you who is in the room. The acceptance rate tells you how many knocked for each offer
Now look at schools, and at two numbers most college profiles show: the average SAT of the students who enroll, and the acceptance rate.
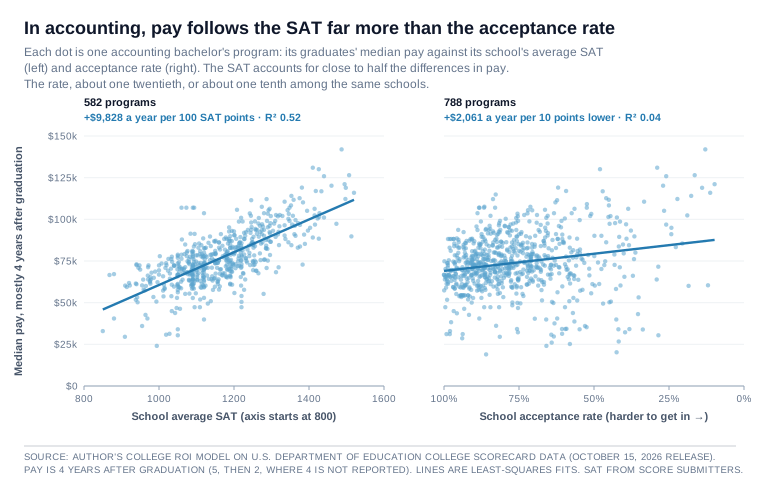
Start with accounting. In the chart below, each dot is one program. On the left, programs line up by the average SAT of each school’s students, and pay climbs. On the right, programs line up by the school’s acceptance rate, with the harder schools to the right as well, and the dots scatter. Programs at schools with the same rate land far apart.[3]
Explore the accounting programs, and every other major, on collegeroi.org.
Back to the pie. In accounting, the SAT accounts for close to half of the differences in pay from one program to the next. The acceptance rate accounts for about one twentieth, and about one tenth at most.[3]
The number many families lean on hardest tells them far less than the SAT does.
Rankings helped teach families to read that number. U.S. News took the acceptance rate out of its formula in the edition it published in 2018.[4] Its 2027 edition says acceptance rates are “no longer used in the methodology,” while still showing them on each school’s profile.[5] It is still the first number I hear a family quote. Why a falling rate mostly counts a rising pile of applications is a story I told in The Ranking Trap.
Across all schools, the same pattern
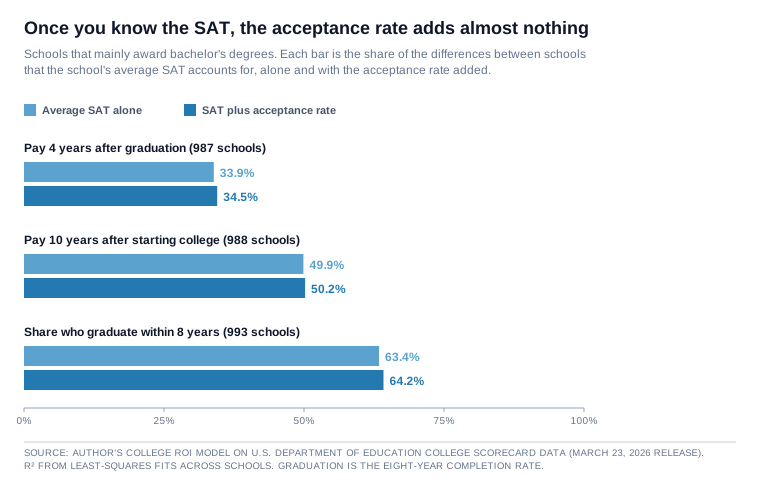
Now step back from accounting. Across 987 schools that mainly award bachelor’s degrees, the average SAT accounts for about a third of the differences in graduate pay. Once you know the SAT, adding the acceptance rate moves that by less than one percentage point. Measure pay 10 years after students start college, and the acceptance rate still adds less than one point.[6]
Accounting is a clean case. In economics, the rate on its own comes close to the SAT, though it adds only about five points of the pie once you know the SAT.[7]
Picture it. Take two schools with the same average SAT, one admitting half its applicants and the other 40 percent. In the same major, the harder school’s graduates earn about $350 to $800 more a year, or about $30 to $70 a month, depending on how the programs are counted.[7] In 100 of 121 majors, the SAT is the better guide to pay.[7] So even after your child picks a field, a harder door adds little about pay once you know the scores.
Finishing follows the same pattern. The average SAT accounts for about 63 percent of the differences in the share of students who graduate within eight years, and the acceptance rate adds less than one percentage point. At those same two schools, the harder one graduates about one more student for every 125.[6]
So once you know the SAT, the acceptance rate adds almost nothing about whether students finish. You don’t have to guess anyway. A school’s graduation rate is public, so look at that number directly.
Why does the acceptance rate add so little once you know the SAT? Partly because the two overlap: schools with high scores tend to have low rates. And a school’s rate moves with its pile of applications. It falls when more students apply and the school admits about the same number, even if the students who enroll stay exactly the same. The SAT describes the students who actually show up.
Scores matter more in some fields than others
How much the SAT matters depends on the field. In finance, computer science, economics, and accounting, a school’s average SAT accounts for close to half the differences in program pay. In nursing it accounts for about 1 percent.[7]
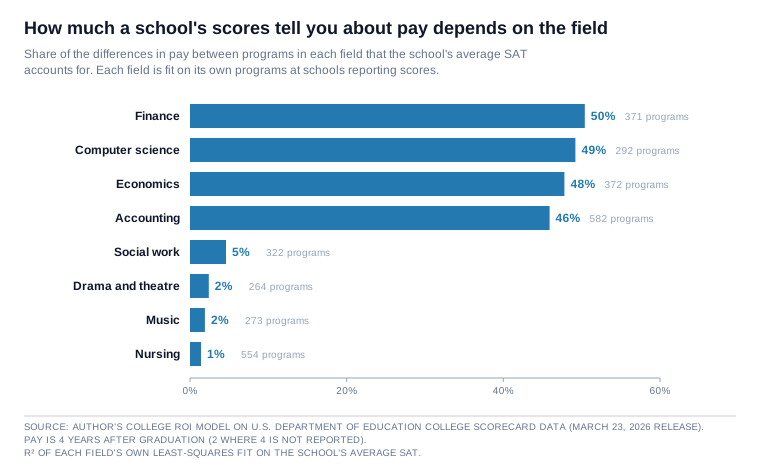
My reading is that scores matter most where employers recruit from a short list of campuses, and least where a license or a pay scale sets the wage. It is the same pattern I described in Yes, the Ivies Produce the CEOs, where what elite schools mostly add is more scouts at the games.
So for a family choosing nursing, a school’s scores say almost nothing about pay, and the bill matters more. For a family choosing finance, it’s worth asking who recruits on each campus.
Scores show who enrolls, not what the school adds
A school’s average SAT is a fact about its students, though. It does not show what the school adds.
Jack Mountjoy and Brent Hickman, working with state records on Texas public universities, found about the same pattern I did: schools with higher average scores show higher pay. So the pattern isn’t a quirk of my model.[8]
But they say outright that the average SAT, their main measure of how selective a school is, tells you almost nothing about how much the school adds to its students’ pay, compared with the other schools a student could attend.[8] Swap in each college’s rejection rate, which is closer to the door itself, and they report it “delivers similar results.”[8]
The room is full of strong students. That does not mean the room made them strong.
Back to your two letters
All of that tells you which number predicts pay across schools. It does not yet tell a family what a harder door is worth for their own child.
So here is the test behind your two letters. I sorted the programs at schools reporting both numbers into groups with the same major and a school SAT within 50 points. Then I compared programs at schools admitting fewer than one in four applicants with programs at schools admitting six in ten or more.[9] Same field. Similar average scores. Different door.
The harder door goes with little or no extra pay: about $160 to $1,140 a year four years after graduation, depending on whether two tuition-free work colleges are counted. At schools that cost $45,000 a year or more, it is about $2,481. Counted group by group, the harder door comes out ahead in 63 of 141 groups, fewer than half. Hold the after-aid price close as well, as in your two letters, and the harder door shows no edge on average, though on only 73 programs at 12 schools. Matches of any kind are scarce: about one in five selective programs has one.[9] Selective schools also send more graduates on to graduate school, so four-year pay may understate what their graduates go on to earn, as I noted in What the Prestige Study Left Out.
How does that compare with your guess?
For the typical graduate, the research finds little edge
Is that small gap the door’s doing? Two well-known studies asked a close question, whether a more selective school raises pay for comparable students, and they say probably not, at least for the typical graduate.
Mountjoy and Hickman compared Texas students who applied to, and got into, the same sets of public universities, then went to different ones. Measuring selectivity by a school’s average SAT, they found “only a fleeting selectivity earnings premium fading to zero after a few years in the labor market.”[8] By 8 to 10 years after students start college, which is about when my model measures pay, they find nothing left.
My groups match school averages, not the same student twice, so a small gap at that point more likely reflects the students themselves, or where graduates go on to work, than the door. One limit: the Texas study covers public universities, and Mountjoy and Hickman caution that it may not reach much more expensive private colleges, which is where the $2,481 gap comes from.[8]
A famous older test points the same way. Stacy Dale and Alan Krueger compared students who were admitted to comparable colleges and then chose differently. The students who went to the more selective school “earned about the same as students of seemingly comparable ability who attended less selective schools.”[10]
In their conclusion they point to the 1963 doctoral research of Shane Hunt at Yale and quote him: “The golden touch is possessed not by the Ivy League College, but by its students.”[10] Their work, the groups of students for whom it found exceptions, and what it looks like once you add the price are in What the Prestige Study Left Out.
The very top is a different story
My model has a blind spot at the very top. Of the 69 schools with an average SAT above 1450, 58 admit fewer than one in four applicants, and only one admits six in ten or more.[6] At that level, high scores and hard doors usually come together, so my model cannot tell them apart. Matched programs at that level, 42 of the 103 in the first pair, supply all of the $2,481 gap, each set against one school. None of the Ivy-Plus colleges has a match in my groups.[9]
The narrow top of that tier is where Raj Chetty, David Deming, and John Friedman did their work, studying students near the admissions line at Ivy-Plus colleges, the Ivy League plus Stanford, MIT, Duke, and Chicago.
Attending one of them instead of an average public flagship “increases students’ chances of reaching the top 1% of the earnings distribution by 50%,” they found. It also raises the odds of an elite graduate school or a prestigious firm. But they found “no significant impact on predicted mean income rank,” meaning little change in where the typical graduate lands.[11]
Comparing Ivy-Plus students with flagship students who had similar scores and backgrounds, the authors estimate a large gain in average pay, about $101,000 a year at age 33, and they trace it to those rare top outcomes.[11] Why that is a long-shot ticket, and who it pays, is the subject of Yes, the Ivies Produce the CEOs.
The authors also say their findings differ from the earlier studies above, and they report that Texas is “unique in exhibiting small differences in outcomes,” so the Texas result may not carry to other states.[11]
So the harder door goes with little or no extra pay, and for students who would get in either way, the Texas research, on public universities, finds no lasting edge from a more selective school. At the very top tier, a harder door also buys better odds at a rare, top-paying outcome.
The bill is where the choice shows up
That leaves price, the one families control most directly.
My model measures lifetime value. Think of it as how far ahead of the high school path a graduate ends up. It counts pay after taxes, then subtracts what college costs and four years of wages given up. It also counts each later dollar for less, at 7.8 percent a year, because money in hand today is worth more than money years from now.
Here are two pairs of letters built from averages across many programs, though in the first pair two schools carry about two-thirds of the easier-door column.[12] Full cost is the published price, in-state at public schools. Net price is what students who get federal aid pay on average after grants.
A private harder door: a little more pay, a higher full price
Two letters, similar scores, same major: a hard-to-get-into private school vs. an easier one (school SAT around 1415)
| Harder door (admits under one in four) | Easier door (admits six in ten or more) | |
|---|---|---|
| Full cost of attendance, per year | $81,504 | $72,155 |
| Average net price, per year | $34,390 | $34,269 |
| Graduate pay, 4 years out | $91,385 | $88,904 |
| Lifetime value at full cost | −$2,860 | +$12,680 |
| Lifetime value at average net price | +$166,681 | +$149,014 |
The harder door goes with $2,481 more a year in pay. It also costs $9,349 more a year at full price, so at full price it ends up about $15,540 behind the easier door.
At the average net price, the two bills nearly match on average, though program by program they often don’t, and the harder door comes out about $17,667 further ahead.
On these averages, that lead is the pay gap, which my model carries through a whole career. If that gap belongs to the students rather than the door, as Dale and Krueger’s research suggests, the door did not earn the lead.
Where that $2,481 comes from
Treat these as rough numbers, because that $2,481 is an average of two very different results.
At the top, among programs at schools with an average SAT above 1450, the harder door pays about $6,755 more a year and stays ahead even at full price. But only one easier-door school has scores that high, so every one of those programs is compared with that same school.
Below 1450, the result flips. The harder door’s graduates earn about $461 less a year. Even after aid, the school costs more, and at the average net price it ends up about $17,850 behind. So all of the extra pay in this table comes from the very top.
There is one more way to count, and it changes the answer. When a program doesn’t report pay four years after graduation, you can fill in its pay at two years. Count that way, and the harder door’s pay edge grows to about $4,208 a year, enough to put it ahead even at full price. But most of that jump is an apples-to-oranges comparison: four-year pay at one school set against two-year pay at another, and pay two years out runs well below pay four years out.[12]
A public harder door: about the same pay, under half the bill
Two letters, similar scores, same major: a hard-to-get-into public university vs. an easier school (school SAT around 1365, in-state prices at public schools)
| Harder door, public (admits under one in four) | Easier door (admits six in ten or more) | |
|---|---|---|
| Full cost of attendance, per year | $27,729 | $58,519 |
| Average net price, per year | $12,567 | $28,846 |
| Graduate pay, 4 years out | $79,741 | $79,514 |
| Lifetime value at full cost | +$101,427 | −$10,801 |
| Lifetime value at average net price | +$155,986 | +$95,979 |
The public school is harder to get into, and its graduates earn about the same, $227 more a year. Its big advantage is the bill. It costs less than half as much for an in-state family, at full price and after aid. The easier schools here are mostly private, which is why they cost more. The same caution applies: above 1450 these programs are set against one school, and below 1450 the public’s graduates earn about $3,266 less a year, though it still comes out ahead on the bill.
Among these harder-door programs, about 63 percent at schools priced like public universities pay off at full price, against about 53 percent at the private ones.[12]
At full price, scores say little about the deal
Think of the pie once more. Across schools, at full price, the average SAT accounts for only about 3 to 11 percent of the differences in lifetime value, because the schools whose graduates earn more tend to charge enough to take much of it back.[13] Scores can tell you something about the pay. At full price, they can’t tell you much about whether it’s a good deal. For that you need the bill.
None of this makes college a price problem. The major still outweighs the bill,[13] and even at zero cost, about 30 percent of four-year institutions still leave their median graduate behind the high school path.[14] Price decides one purchase in particular: paying extra for a harder door. At full private prices, the harder door ends up behind on average.
If your child could open either door
Now the student who gets into both.
For a strong student, the typical paycheck mostly travels with the student. Most of the research above finds that the typical top student who picks a strong but less famous school lands close to where they would have landed at the famous one.[8][10][11] Dale and Krueger compared selective colleges, and Chetty, Deming, and Friedman compared Ivy-Plus colleges with state flagships, so keep the other door a strong one. They don’t say a top student earns the same anywhere.
That leaves the price, and the answer depends on what your family would pay.
If aid makes the famous school close to free, or cheaper than the other door, take the seat. That is a gift of price, and the name comes with it at no extra charge. The exception in Dale and Krueger’s 2002 paper, students from low-income families, points the same way.[10]
If your family would pay full price, the choice is different. You would be paying for two things the typical paycheck doesn’t show: better odds at that rare, top-paying outcome, and the network, meaning a better chance at an elite graduate school or a prestigious firm.[11] The large $101,000 estimate above comes from those rare outcomes.
These gains are real, and they are bigger for students with weaker options at home.[11] Some families want them and can afford them. If you choose the less famous school, that’s what you give up, and the money stays with your family.
I work through this choice, with the prices, in a follow-up piece.
For almost any field, there are cheaper doors to the same pay
The two letters are averages. The bigger lesson sits in the charts on every program page. Pick almost any field and look at the dots. For most programs, several others in the same field cost less and pay their graduates as much or more.
Across 141 majors, about four in five programs have at least three others in the same field that cost at least $5,000 a year less and pay as much or more. The typical program has 16 to 20, depending on whether two-year pay is counted. Use the price families pay after aid, and the share barely moves. Even at schools that admit fewer than one in four, about six in ten to two in three programs have at least three, or somewhat fewer on the price after aid.[15]
These counts compare programs, not your child’s chances. Pay reflects who each school enrolls, and public prices are in-state, so use these counts as a place to start.
The chart shows accounting. Of the 330 programs that cost $45,000 a year or more, more than nine in ten have at least three cheaper programs paying as much or more.[15]
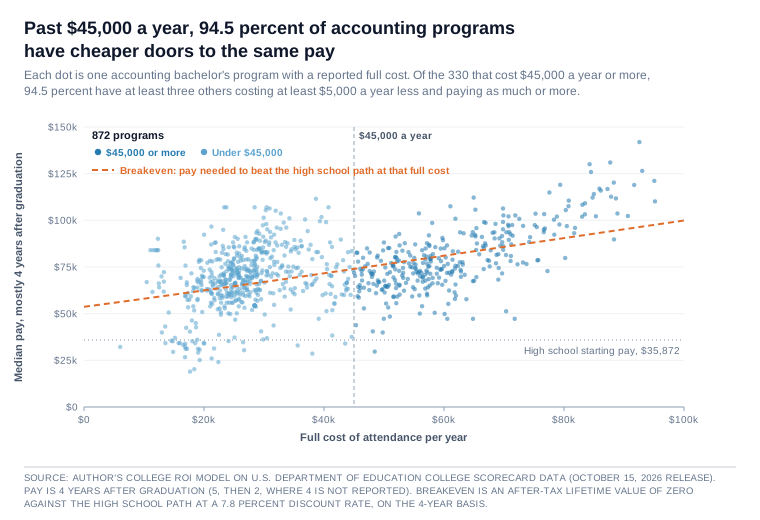
Explore every major’s cost and pay on collegeroi.org.
These pay figures count only graduates, so add one more test: the cheaper school graduates at least as large a share of its students. The list gets shorter. About six in ten programs still have three or more such choices. For the selective programs, fewer than three in ten do. Some of that gap is who each school enrolls, but it is exactly why the numbers need running one school at a time.[15]
So once a family has settled on a field, the next step is to open the list wider before narrowing it. Look past the familiar names to the schools teaching the same field for less. Then run the numbers on each one: the price your family will pay after aid, and the share of students who finish.
Open your options, then run your numbers. That habit is where the money is.
So what should a family do?
Go back to the concert. Selling out tells you more people wanted in than the hall could seat. It does not tell you how good the show will be, and it does not tell you whether the ticket price is fair.
Choose the field first, because pay differs most by field. Then compare the bills, using the price your family will actually pay. Your child’s own scores go with them to any school. When it comes to what a degree pays, once you know the students’ scores, the acceptance rate is a number you can safely skip.
Companion Pieces
- The Ranking Trap: why a falling acceptance rate mostly counts applications.
- What the Prestige Study Left Out: the Dale and Krueger studies, their exceptions, and what they look like with the price added.
- Yes, the Ivies Produce the CEOs: the rare top outcomes, and who the long-shot ticket pays.
- The program pages on collegeroi.org: pay against SAT and acceptance rate, school by school, for undergraduate programs in most majors.
Reference Sources
- Author’s model, 30,654 bachelor’s programs mapped to a major, College Scorecard March 23, 2026 release. Earnings are median earnings four years after graduation, or two years where four are not reported. The two spread figures use four-year earnings only.
- Within-school spread: across the 876 institutions with 10 or more programs reporting four-year earnings, the median of each school’s 10th-percentile program is $45,822 and the median of each school’s 90th-percentile program is $81,755. The median of each school’s own 90th-minus-10th gap is $35,164.
- Between-school spread: the 90th percentile of those institutions’ mean program earnings is $78,097 and the 10th percentile is $52,870, a gap of $25,227.
- Variance in program median earnings explained by major alone: 52.3 percent. By institution alone: 26.8 percent. On four-year earnings only (26,052 programs): 59.2 percent and 32.0 percent.
- Field and price: among the 1,679 bachelor’s institutions, engineering programs’ median four-year earnings are $90,664 at schools in the cheapest quarter by full cost and $97,268 in the most expensive quarter (439 and 355 programs). Music programs earn $44,058 and $43,343 (78 and 58).
- Kirkebøen, Lars, Edwin Leuven, and Magne Mogstad. “Field of Study, Earnings, and Self-Selection.” NBER Working Paper 20816, December 2014. Published in the Quarterly Journal of Economics 131, no. 3 (2016): 1057–1111. Accessed October 7, 2026. Norway’s centralized admission process sorts applicants near unpredictable admission cutoffs into different fields of study, which the authors use to estimate the payoff to each field while holding fixed each applicant’s next-best choice. The quoted finding is from the abstract. The authors also find that people tend to choose fields where they have a comparative advantage.
- Author’s model, College ROI program page for the accounting bachelor’s degree, collegeroi.org, built on U.S. Department of Education College Scorecard data (October 15, 2026 release). Accessed November 9, 2026. This note’s figures, and the accounting line in note 15, use that release, the one the live page shows. The piece’s other model figures use the March 23, 2026 release, except the five-year check in note 6. Each program’s median earnings four years after graduation (five years, then two, where four are not reported) are fit by ordinary least squares against the institution’s average SAT score and, separately, against its undergraduate acceptance rate. SAT: 582 programs at schools reporting scores, leaving out a few whose score rests on very few test takers, +$9,828 a year per 100 points, R² 0.52. Acceptance rate: 788 programs at schools reporting a rate, +$2,061 a year per 10 points lower, R² 0.04. On the 582 programs at schools reporting both an SAT and an acceptance rate, the acceptance rate’s R² is 0.102. R² is the share of the differences in median pay between programs that the single measure accounts for, not a share of any one student’s outcome. The Scorecard’s data dictionary calls its figure the “Average SAT equivalent score of students admitted.” The IPEDS form behind it collects scores for enrolled students, which is how I describe it, and only for students whose scores were used in the admissions decision. It appears to combine each school’s median SAT with its median ACT converted to the SAT scale, weighted by how many students submitted each. That reading reproduces the figure within one point at 852 of the 920 schools reporting both tests in the 2022-23 file. No adjustment is made for who enrolls.
- Morse, Robert, Eric Brooks, and Matt Mason. “How U.S. News Calculated the 2019 Best Colleges Rankings.” U.S. News & World Report, September 2018, archived October 1, 2018. Accessed October 7, 2026. “New for 2019, acceptance rate (1.25 percent in last year’s ranking) has been completely removed from the ranking calculations to make room for the new social mobility indicators.”
- Brooks, Eric. “How U.S. News Calculated the 2027 Best Colleges Rankings.” U.S. News & World Report, September 21, 2026. Accessed October 7, 2026. Peer assessment carries 20 percent and standardized tests 5 percent. The edition adds “a new factor on graduates’ earnings by major (5%) that replaces a median federal loan debt factor.” Acceptance rates, alumni giving, class size, and high school class rank “are no longer used in the methodology but are updated in school profiles.”
- Author’s model, 987 institutions whose predominant award is the bachelor’s degree and which report an average SAT, an acceptance rate, and the earnings measure (988 on the 10-year measure), College Scorecard March 23, 2026 release.
- Median earnings four years after graduation (completers only): average SAT R² 0.339, acceptance rate R² 0.170, both together 0.345.
- The Department of Education later reported that a code error put some graduate completers into this school-level four-year figure, at schools offering both levels (errata, October 15, 2026). Program-level figures were not affected. On the five-year figure in the October release, the same test on 992 institutions gives SAT R² 0.39, acceptance rate R² 0.17, both together 0.39, so the order does not change.
- Median earnings 10 years after entry (all federally aided students who enrolled, whether or not they finished): SAT R² 0.499, acceptance rate R² 0.223, both together 0.502.
- Raw slope on the SAT: +$6,262 a year per 100 points (four-year measure) and +$7,489 (10-year).
- Above an average SAT of 1450 there are 69 institutions. Of these, 58 admit under 25 percent, 10 admit 25 to 60 percent, and 1 admits 60 percent or more.
- Acceptance rates are the Scorecard’s reported admission rate. Schools without one are excluded, never assigned a rate.
- Graduation rate is the Scorecard’s eight-year completion rate (pooled), for 993 institutions reporting a graduation rate (earnings not required): average SAT R² 0.634, acceptance rate R² 0.302, both together 0.642. Holding SAT fixed, +0.8 percentage points per 10 points lower acceptance rate (about one more graduate for every 125 students) and +7.6 points per 100 SAT points.
- Author’s model, 21,605 bachelor’s programs in 282 majors at institutions reporting both measures.
- Variance in program median earnings explained: major alone 54.0 percent, major plus average SAT 61.2 percent, major plus SAT plus acceptance rate 61.3 percent.
- Within-major slopes from the three-way model: +$4,303 a year per 100 SAT points, +$346 per 10 points lower acceptance rate.
- On four-year earnings only (18,307 programs in 278 majors), the same within-major slopes are +$4,311 a year per 100 SAT points and +$817 per 10 points lower acceptance rate.
- Of the 121 majors with at least 30 institutions reporting both, the SAT has the higher R² in 100.
- Economics: SAT R² 0.478, acceptance rate R² 0.428 (0.466 on programs reporting both), adding 0.048 over the SAT.
- Field values are each major’s own fit on schools reporting scores: Finance 0.50, Computer Science 0.49, Economics 0.48, Accounting 0.46, Registered Nursing 0.01, Music 0.02, Drama and Theatre 0.02, Social Work 0.05.
- Mountjoy, Jack, and Brent Hickman. “The Returns to College(s): Relative Value-Added and Match Effects in Higher Education.” NBER Working Paper 29276, September 2021. Accessed October 7, 2026. Texas administrative data. The raw slope of $6,400 per 100 SAT points and the “uninformative predictor” sentence are in Section 6.1, “Selectivity vs. Value-Added.” The fading-premium sentence and the instructional-spending finding are in the abstract. The year-by-year timing is in the discussion of Figure 8, where selectivity is school mean SAT. The rejection-rate check is footnote 42, attached to the Figure 6 value-added result. The sample is 30 Texas public universities, and footnote 12 cautions that the results may not reach much more expensive private colleges. In my model the same raw slope is +$6,262 a year per 100 points four years after graduation and +$7,489 for aided students 10 years after they started (note 6). Theirs is about $6,400, before any adjustment, measured 8 to 10 years after entry. These are different students in different years, so the numbers are close rather than identical. On what a college does add, they find “non-peer college inputs like instructional spending more strongly predict value-added” than selectivity does. Section 8.2 reports “little evidence of significant heterogeneity in the returns to selectivity by gender, family income as measured by FRPL eligibility, cognitive skills as measured by high school test scores, and non-cognitive skills as measured by high school attendance.” It goes on: “Black students are the main exception to this trend,” with small negative impacts of selectivity, a pattern the authors say is “driven by the two large historically Black universities (HBCUs) in Texas.”
- Author’s model. Programs grouped by major and 50-point band of institution average SAT. “Selective” means an institutional acceptance rate under 25 percent and “broad” means 60 percent or more. Programs use four-year earnings only, so every comparison sets four-year pay against four-year pay. A group counts when it holds at least one of each: 141 groups. Schools with no score or rate are left out, as are a few whose score rests on very few test takers and looks unreliable.
- Per selective program, against the broad mean of its own group: +$161 a year (272 programs) and +$1,137 excluding two tuition-free work colleges, Berea College and College of the Ozarks (255).
- Split by full cost, work colleges excluded: +$2,481 at schools with a full cost of $45,000 or more and +$226 under $45,000 (the rounded table cells differ by $227).
- Per group: mean −$1,351 and median −$1,505. The selective program leads in 63 of 141 groups. Without the work colleges: 132 groups, mean −$132, median −$160, and it leads in 64.
- With the after-aid price also held close, against the broad mean of the group: −$8,242 within $2,500 a year (25 programs, 5 schools), −$3,112 within $5,000 (73, 12), −$260 within $7,500 (93, 14). Within $5,000, the 73 split into +$8,791 on 20 programs above an average SAT of 1450 and −$7,604 on 53 below it.
- Coverage: 272 of the 1,215 selective programs reporting both measures have a match, at 33 schools. No Ivy-Plus college is among them.
- A wider rule uses two-year earnings where four-year earnings are not reported. On that rule: 176 groups, +$2,235 (406 programs), +$3,803 (376), +$4,208 at $45,000 or more, +$3,433 under, and the selective program leads in 83 of 176. That rule can set one school’s four-year pay against another’s two-year pay. Among the 15,562 programs here reporting both, four-year pay is about 1.6 times two-year pay at the median. In the first pair on that rule, for harder-door programs reporting four-year pay, the gap is −$546 where every easier-door program in the group reports four-year pay (77 programs) and +$25,202 where every one reports only two-year pay (43).
- These are descriptive comparisons, with no adjustment for who enrolls beyond the SAT band.
- Dale, Stacy Berg, and Alan B. Krueger. “Estimating the Payoff to Attending a More Selective College: An Application of Selection on Observables and Unobservables.” Quarterly Journal of Economics 117, no. 4 (2002): 1491–1527. Accessed October 7, 2026. The comparison sentence is from the abstract. The Hunt quotation (1963, p. 56) is in the paper’s conclusion, which introduces it as consistent with his research. The reference list gives his work as a Yale Ph.D. thesis. Earnings are self-reported pre-tax 1995 earnings of the College and Beyond 1976 entering cohort. The abstract also says: “Children from low-income families, however, earned more if they attended selective colleges.”
- Chetty, Raj, David J. Deming, and John N. Friedman. “Diversifying Society’s Leaders? The Determinants and Causal Effects of Admission to Highly Selective Private Colleges.” Published in the Quarterly Journal of Economics, February 2026. Circulated as NBER Working Paper 31492, July 2023, revised August 2025. Accessed October 7, 2026. Quotations are from the August 2025 revision.
- The top-1 percent effect is from the abstract.
- The mean-rank finding is from the waitlist analysis in Section 4. In Table 4, the effect on predicted mean income rank is 0.25 on the waitlist design, 1.78 on the matriculation design, and 1.85 on the observational estimate.
- Waitlist estimates, flagship then Ivy-Plus: top quarter of earners 73.3 and 73.3 percent, elite graduate school by 28 6.1 and 11.8, prestigious firm by 25 7.2 and 24.7 (Table 4).
- The authors also write that the effects “are much larger for students with weaker fallback options,” such as students whose home-state colleges send fewer graduates to the top 1 percent.
- The statement that the findings differ is in the introduction. The Texas sentence is footnote 36, which compares Texas with in-state applicants in California (Appendix Figure 26).
- The $101,000 increase in mean earnings at age 33, relative to a counterfactual mean of $143,000, is from the introduction, which attributes it to “these upper-tail impacts.” It compares Ivy-Plus students with flagship students reweighted on test score, race, gender, and parent income (Section 4.5, Appendix Figure 28a). The waitlist design, the authors write, lacks “adequate precision” to estimate mean income in dollars (Section 4.3).
- Author’s model, the matched groups of note 9, four-year earnings only, work colleges excluded. Each selective program is set against the mean of the broad-admission programs in its own group, and the columns average those pairs.
- First pair: 103 selective programs at schools with a full cost of $45,000 or more (mean school SAT 1420, matched broad mean 1410).
- Second pair: 152 selective programs at schools under $45,000, 150 of them at public universities, led by Florida State (58 programs) and Florida (18) (mean school SAT 1362, matched broad mean 1366). The easier-door schools in the second pair are mostly private, which is why their cost runs higher.
- Lifetime value is the after-tax net present value of the college path minus that of the high school path ($484,376), at a 7.8 percent discount rate, over four years of cost. Starting salary is four-year earnings divided by 1.02 cubed.
- Cost definitions are from the College Scorecard’s data documentation: cost of attendance is for students “paying the in-state or in-district tuition rate,” and average net price is cost of attendance “less all grant aid for federal aid recipients.”
- The tables average across many programs and are not any single school’s figures.
- On the wider rule, with two-year pay added: first pair +$4,208 in pay, +$35,542 in lifetime value at net price, +$3,620 at full cost (179 programs). Second pair +$3,433, +$87,327, +$144,514 (197).
- In the first pair, 42 of the 103 selective programs sit above an average SAT of 1450, each compared with one school, Rensselaer Polytechnic Institute, at +$6,755, ahead by $35,864 at full cost and $69,250 at net price, at $5,076 a year less after aid. Without those 42, the pay gap is −$461, on 61 programs at 9 schools, and lifetime value at net price is −$17,850, at $3,699 a year more after aid, and −$50,932 at full cost. Rensselaer and Southern Methodist University carry 66 percent of the easier-door column’s weight.
- In the second pair, 40 of the 152 sit above 1450, each also compared with Rensselaer alone. Without them, the pay gap is −$3,266 and the lifetime-value lead at net price is about $26,926. Rensselaer and Southern Methodist carry 38 percent of that column.
- Selective programs with positive lifetime value at full cost: 95 of the 152 under $45,000 and 55 of the 103 at $45,000 or more. On the wider rule, across all 529 selective programs reporting both measures with positive lifetime value at full cost, 168 are under $45,000, about one in three. Counting whole colleges instead, as in What the Prestige Study Left Out, 40 of the 81 colleges that admit fewer than one in four leave their median graduate behind the high school path at full price.
- Author’s model, 985 bachelor’s-predominant institutions with cost data, lifetime value computed as in note 12 from each school’s median earnings.
- At average net price, the average SAT accounts for 22.5 percent of the differences in lifetime value four years after graduation and 39.5 percent on the 10-year measure (starting salary from 10-year earnings divided by 1.02 to the fifth power).
- At full cost of attendance, it accounts for 3.2 and 11.3 percent.
- Holding SAT and acceptance rate fixed, each $10,000 a year of full cost goes with $34,627 less lifetime value on the four-year measure and $27,614 less on the 10-year measure.
- At the program level (21,605 programs, 282 majors), major alone accounts for 53.5 percent of the differences in lifetime value at full cost, adding SAT and acceptance rate brings it to 53.7 percent, and adding full cost raises it to 63.1 percent.
- Shivamber, Leon. “College ROI Model and Calculator.” collegeroi.org, 2026. Accessed October 7, 2026. The author’s after-tax net present value model, built on U.S. Department of Education College Scorecard data, covering 1,679 bachelor’s-granting institutions. Even at zero cost, about 30 percent of four-year institutions still leave their median graduate behind the high school path.
- Author’s model, bachelor’s programs mapped to a major with a reported full cost of attendance (College Scorecard COSTT4) and median earnings (four years after graduation, two where four are not reported), College Scorecard March 23, 2026 release. 30,214 programs, 28,796 of them in the 141 majors with at least 30 programs.
- For each program, the count of other programs in the same major whose full cost of attendance is at least $5,000 a year lower and whose median earnings are equal or higher.
- Programs with three or more such alternatives: 82.3 percent, with a median count of 20.
- Majors in which more than half of the programs in the top quarter by cost have three or more: 136 of 141.
- Programs at institutions admitting under 25 percent: 68.8 percent of 1,587, median 10.
- Accounting programs with a full cost of $45,000 or more, on the October 15, 2026 release as in note 3: 330, of which 94.5 percent have three or more, median 170.
- Same count on average net price instead of full cost: 81.1 percent of 28,795 programs, median 19 (selective programs 61.7 percent, median 6).
- Adding a third test, that the cheaper school’s eight-year graduation rate is at least as high (full-cost basis): 61.9 percent of 28,749 programs with a graduation rate have three or more, median 6. For programs at schools admitting under 25 percent: 28.7 percent of 1,582, median 0.
- On four-year earnings only (24,237 programs in 130 majors): 80.8 percent, median 16. At institutions admitting under 25 percent: 61.2 percent of 1,245, median 6, or 54.7 percent, median 3, on average net price. On average net price: 79.8 percent, median 17. With the graduation-rate test: 59.5 percent, median 5, and 22.2 percent for programs at schools admitting under 25 percent.
- Earnings count graduates only, and graduation rates differ by school. Compare completion as well as price.